Debugging JS 101
Once you have successfully compiled and exported your project using the Playworks Plugin, you will be able to test and review your creative in the browser.
A Develop Build is structured in the following way:
UnityScriptsCompiler.jsincludes all user scripts, now in JavaScriptindex.htmlhandles the loading and displaying of the playable contentUnityEngineincludes our implementation of the Unity Engine API interfacescript0-script6include internal engine code, and are minified
Using Chrome DevTools
At times, you may find that you experience JavaScript errors in the browser; errors can be caused for a number of reasons. To successfully understand and fix these errors, we recommend using the Chrome browser and powerful developer tools provided.
For more information and guides on DevTools, please refer to the Google Chrome DevTools documentation.
Get Started With Debugging
- Build a develop build from Playworks Plugin.
- Start the server which will automatically open a tab in your browser.
Once opened, you can access Chrome DevTools by pressing command+option+i (Mac) or control+shift+i (Windows, Linux) to access the console view of the Chrome page to see what's happening under the hood.
Once open you will be presented with a spilt browser that will give a breakdown of the processes from the page. If there is an error it will be shown here.
Browser Error Types
Yellow Warnings
The scene will run, but these could be things that may have been changed or altered during the conversion to JS. Typically, these shouldn't be any cause for concern, but of course you should review them, if these are the only messages, in case unintended problems occur.
Red Errors
These are runtime failures - usually it's easy to identify which code is the problem. Typically, you can click the error and be presented with more information including a stack trace in Chrome dev tools. See below for more information.
Using DevTools dev tools.
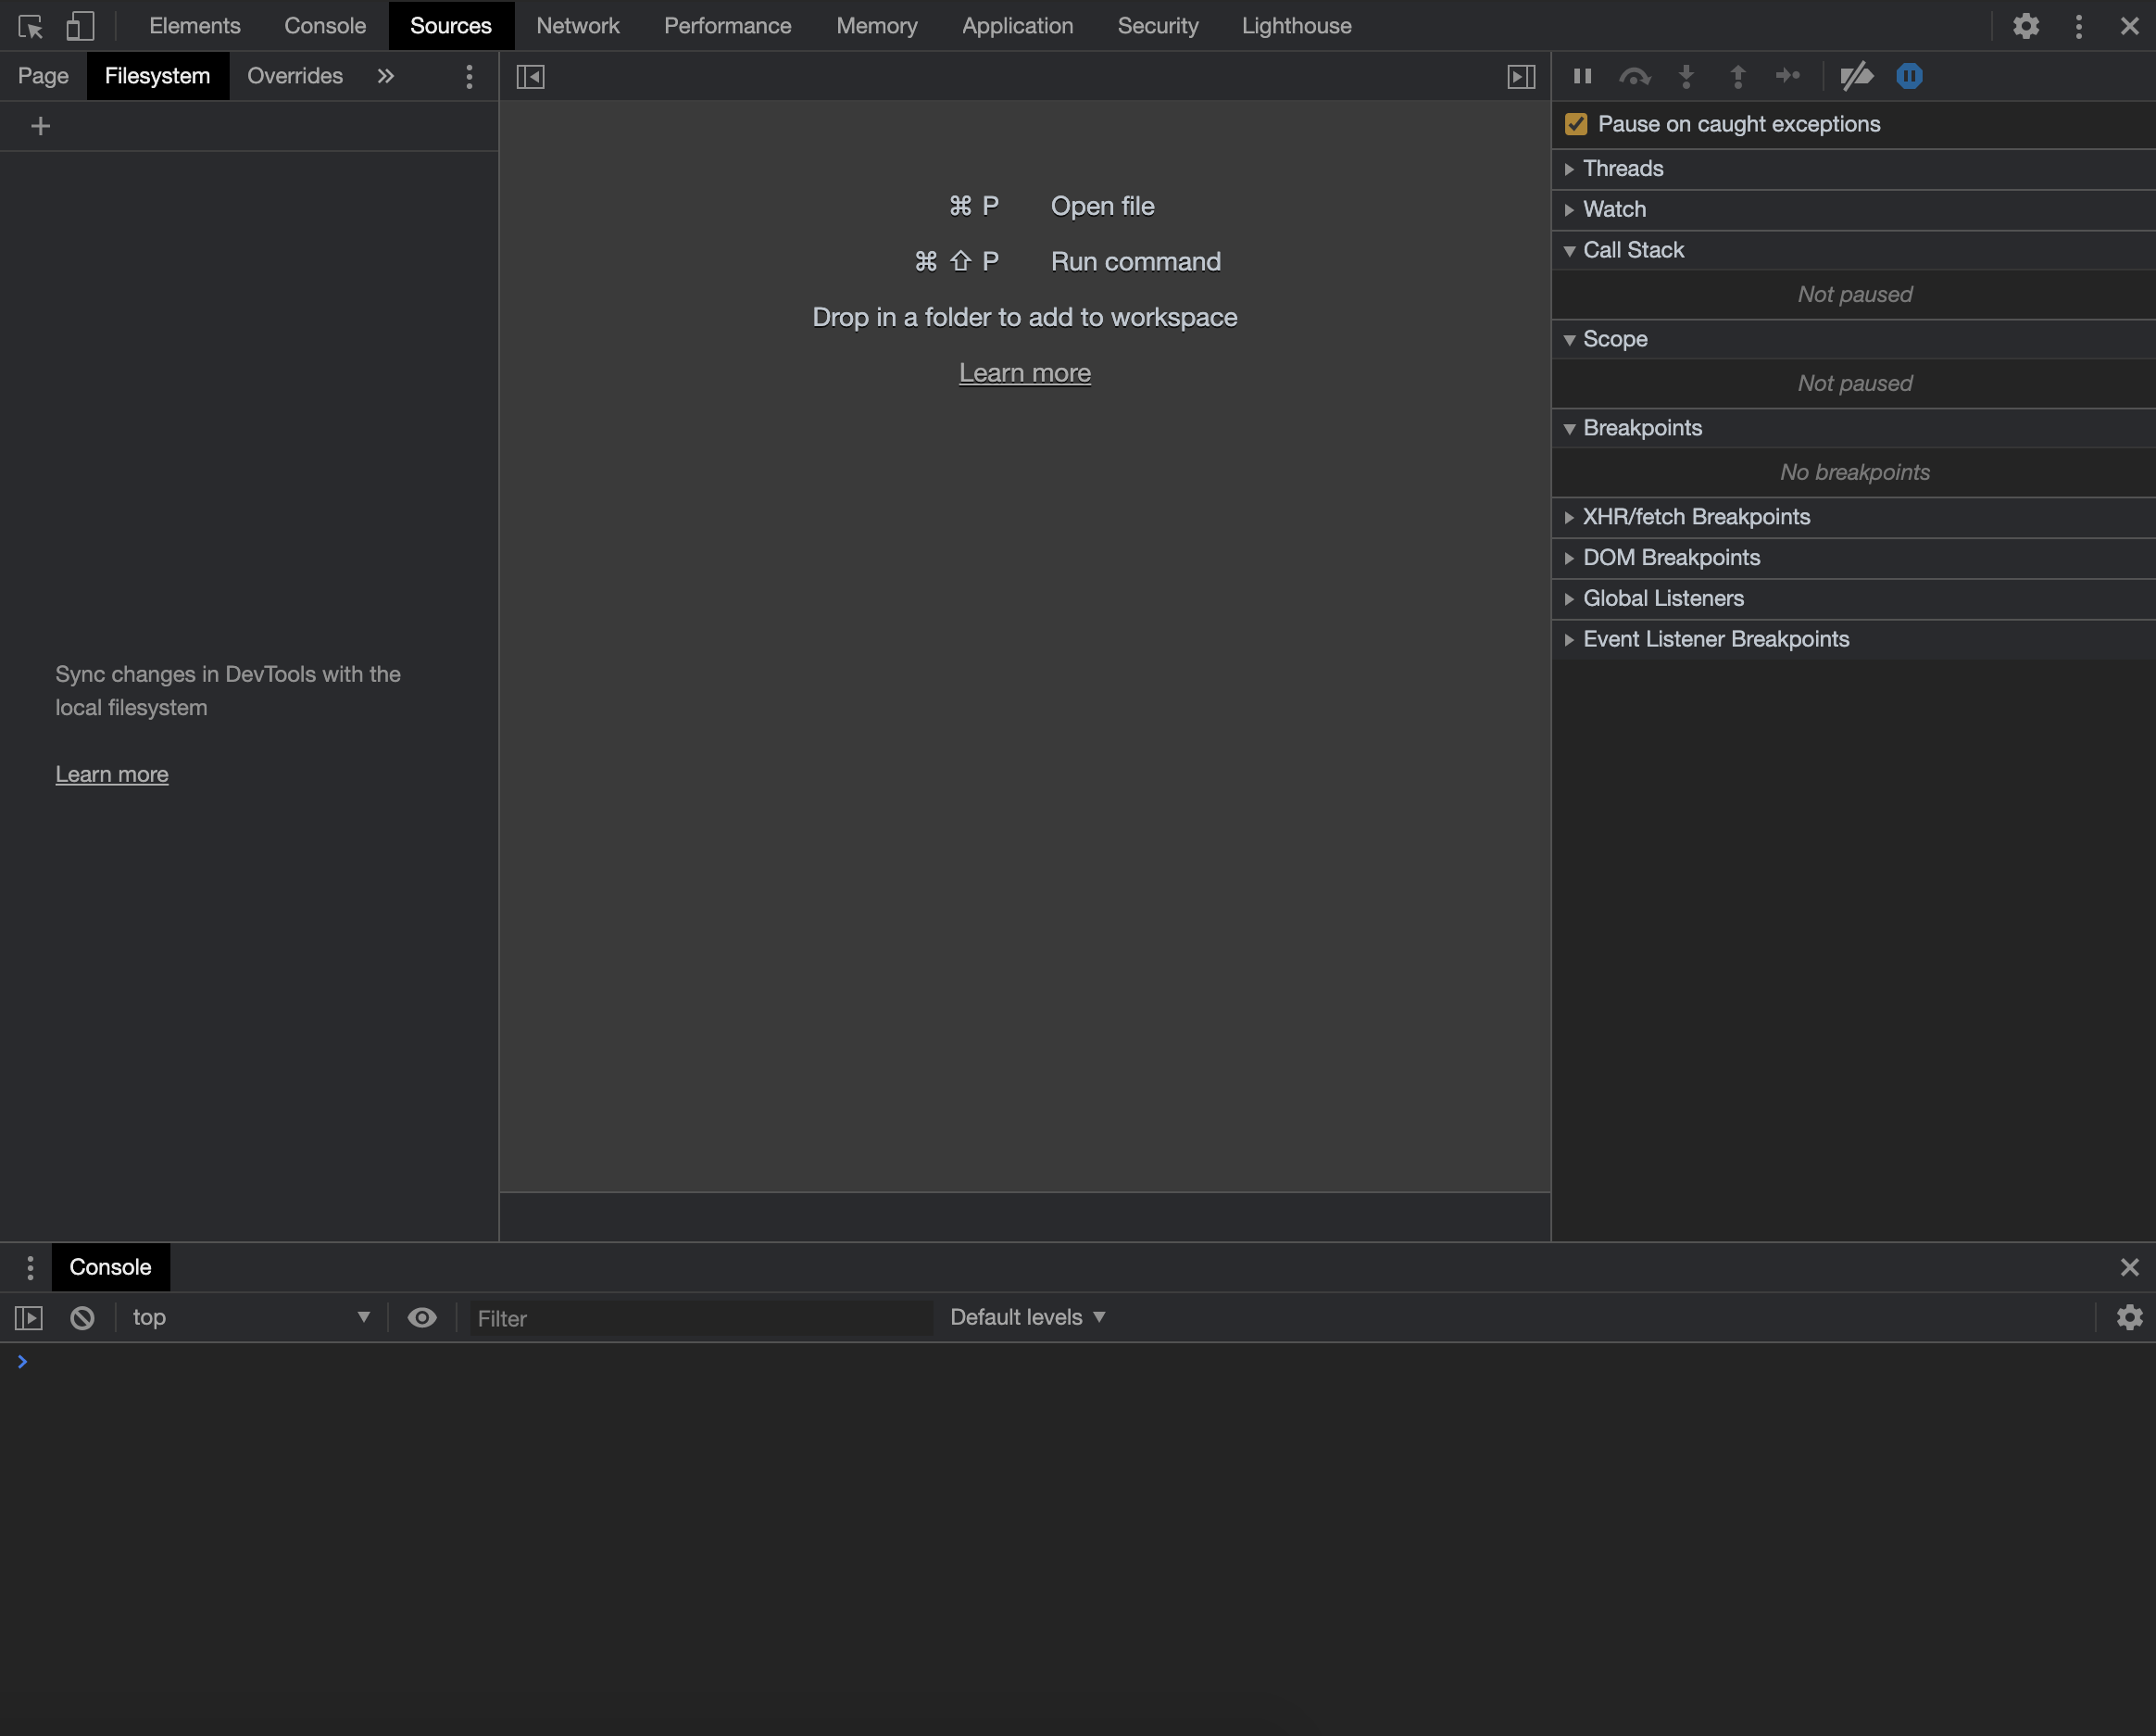
When debugging in Chrome, you will commonly use the Sources tab.

Let's look at each panel in the Chrome window to see what each section is used for and how to navigate it.
You can quickly open converted user code in the browser by typing command+shift+p and typing UnityScriptsCompiler and pressing enter. As mentioned above, UnityScriptsCompiler.js includes all user scripts.
- The File Navigator panel is on the left. Every file that the page requests is listed here. Clicking on a file will show the contents of the file.
- The Code Editor panel is in the centre. After selecting a file in the File Navigator panel, the contents of that file are displayed here.
- The JavaScript Debugging panel includes various tools for inspecting the page's JavaScript.
Error Examples
Unity Playworks Plugin Browser Error: Example 1
Here is an example error that you may encounter when using Unity Playworks Plugin, and how you can debug this using Chrome DevTools.

The error and partial stack trace is printed to the console in DevTools. This is helpful in determining where in the compiled JavaScript code your error occurred.
In the above example, the stack trace touches multiple script and also touches UnityScriptsCompiler.js which contains all the converted (C#) user code.
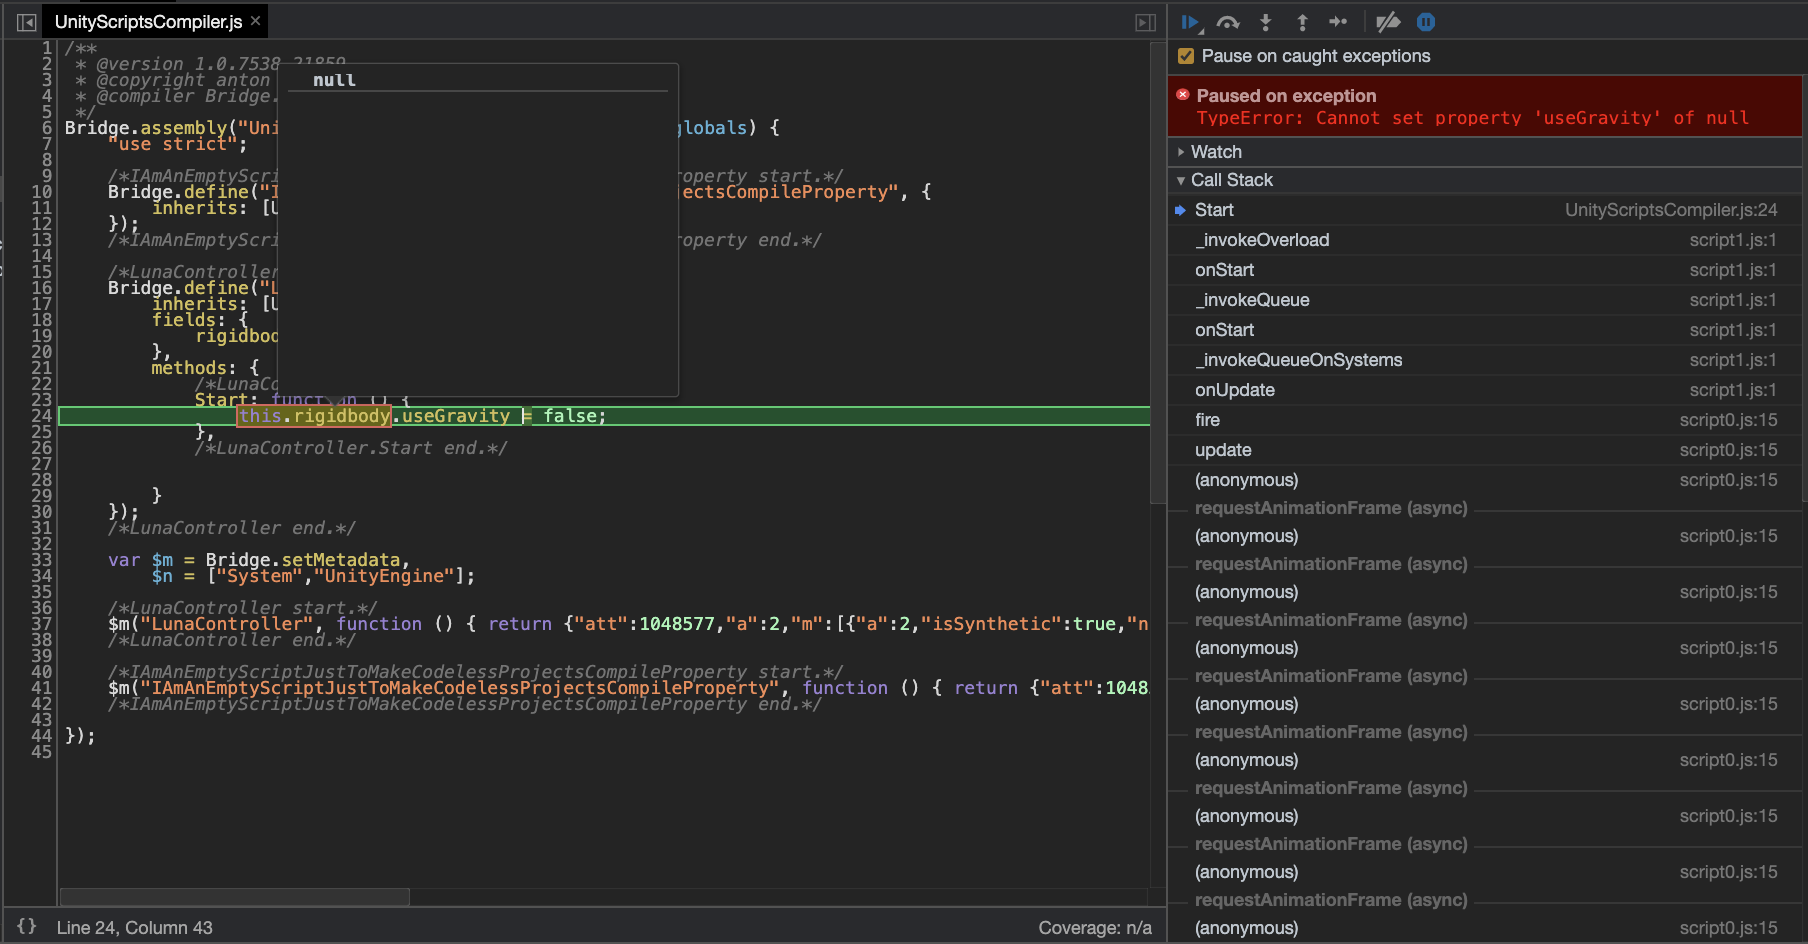
Clicking the UnityScriptsCompiler.js link in the stack trace will open this file and highlight the relevant line of code which you can use to trace where the error originated.

A good way to see where the problem code exists in your C# code, is via the code editor pane of the Chrome DevTools. The converted code from C# scripts are commented above the section it resides within.
/*LunaConroller.Start start.*/
Start: funtion() {
  this.rigidody.useGravity = false;
},
/*LunaConroller.Start end.*/
Once identified it should provide you with an idea of what to fix. In this case we can see the Rigidbody is set to null. The solution is to make sure we have a Rigidbody attached to our object in Unity.
Unity Playworks Plugin Browser Error: Example 2
A common error in the browser when using Unity Playworks Plugin is a ctor error message. This can occur when scripts are attempting to call a constructor method from a script that might not be included in the build, is being called in the wrong execution order or is an un-implemented method.

When debugging this, it's helpful to identify where this code is being called from the user code. A few common things to consider for ctor errors:
- Is the call is in a script that may have been excluded?
- Is the call being made in the right execution order?
- Is the method implemented method in Unity Playworks Plugin?


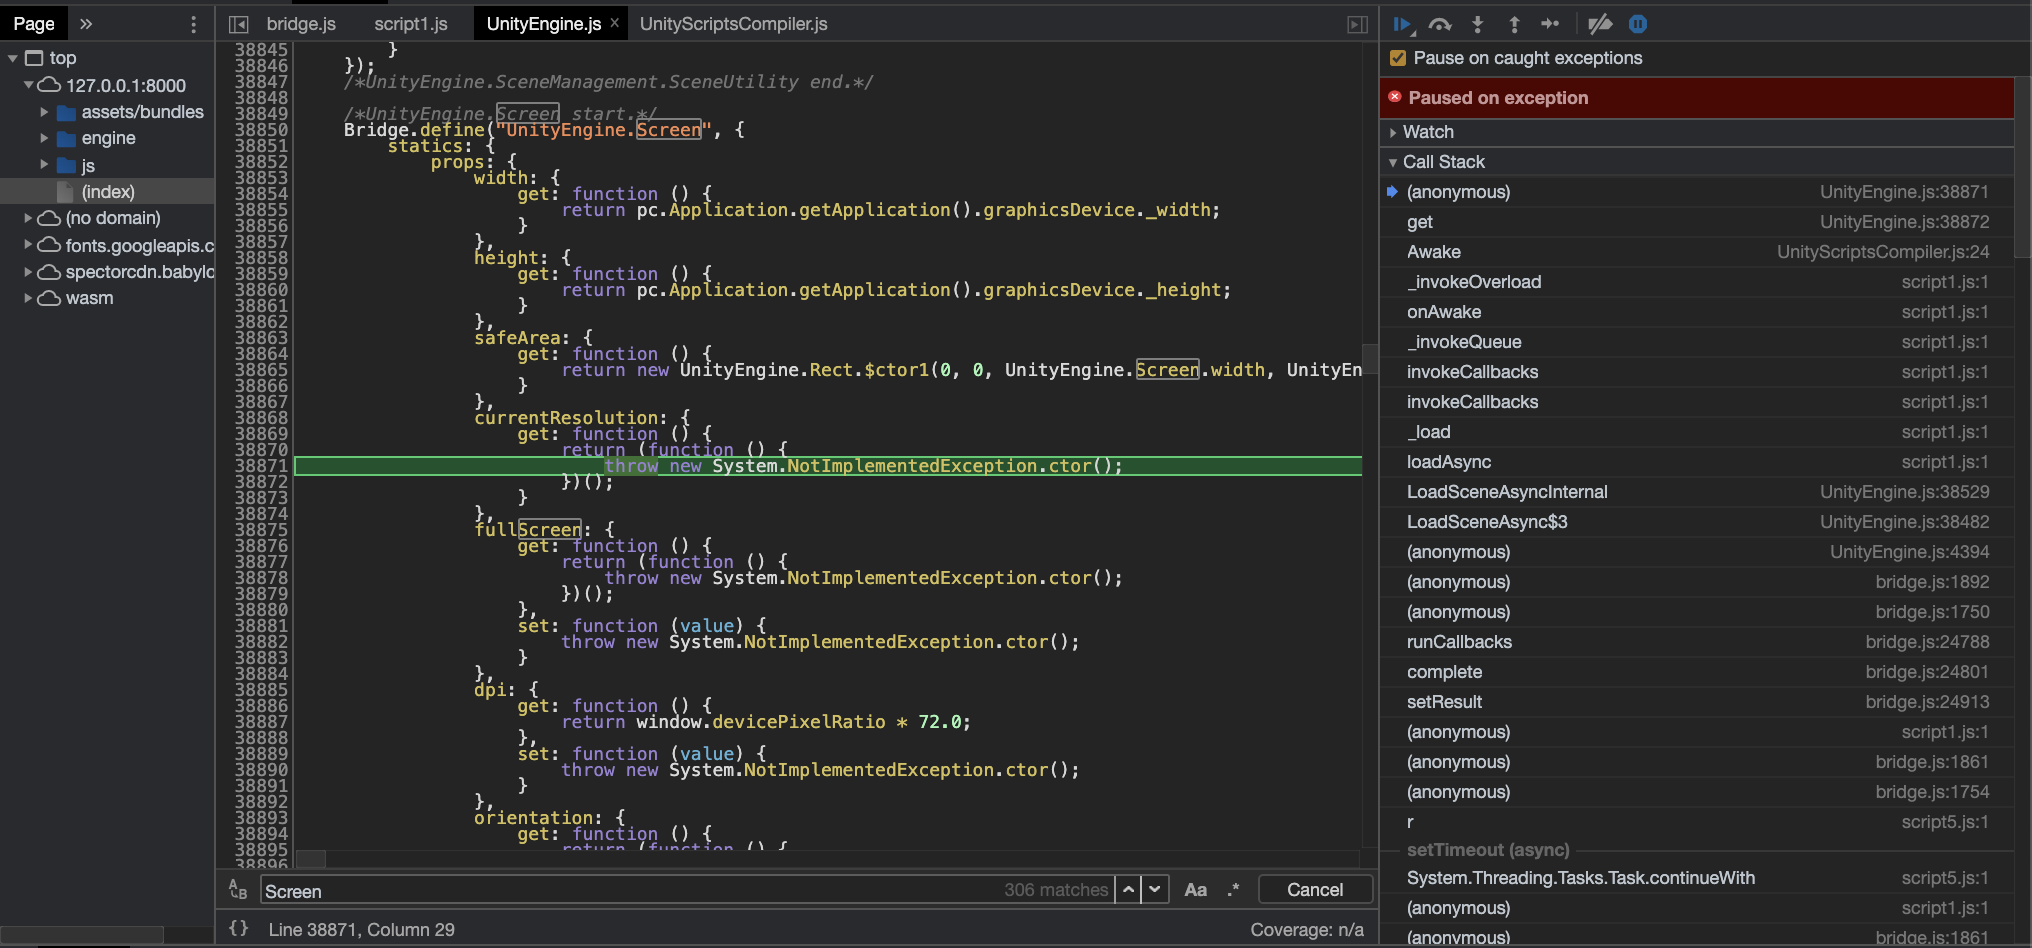
In this example we can check the code by following the stack trace and identifying that the error originated in the Awake method from our converted C# code (which as mentioned before is contained in UnityScriptsCompiler.js).
At the top of the stack trace there is also an UnityEngine.js call, which defines Plugin's implementation of the Unity engine. As shown in the second image above we can see that the method being used in the Awake method is not yet implemented in Unity Playworks Plugin.
In most cases, it is simple to work around an un-implemented method. Here, Screen.currentResolution can be replaced with a method that gets the resolution of the screen by using Screen.width and Screen.height, which are supported methods in Plugin.