Unity Playworks Plugin Debugger
Overview
The Unity Playworks Plugin Debugger is a powerful tool that allows developers using Playworks Plugin to inspect and debug develop builds directly in the browser. The interface will be familiar to users of the Unity Editor, weve incorporated similar components like hierarchy and inspector panels so that you can debug a Playworks Plugin build in real time just as easily as you would a Unity scene.
The tool is available to all Unity Playworks Plugin customers as a free browser extension in the Chrome Web Store.
How to get started
- Install the Unity Playworks Plugin Debugger Chrome extension from the Chrome Web Store
- Open a Playworks Plugin develop build in Chrome
- Use the keyboard shortcut Option + ⌘ + I (on macOS), or Shift + CTRL + I (on Windows/Linux), to open the Chrome DevTools panel
- At the furthermost right of the DevTools tabs you should now see Luna, click this to open the debugger
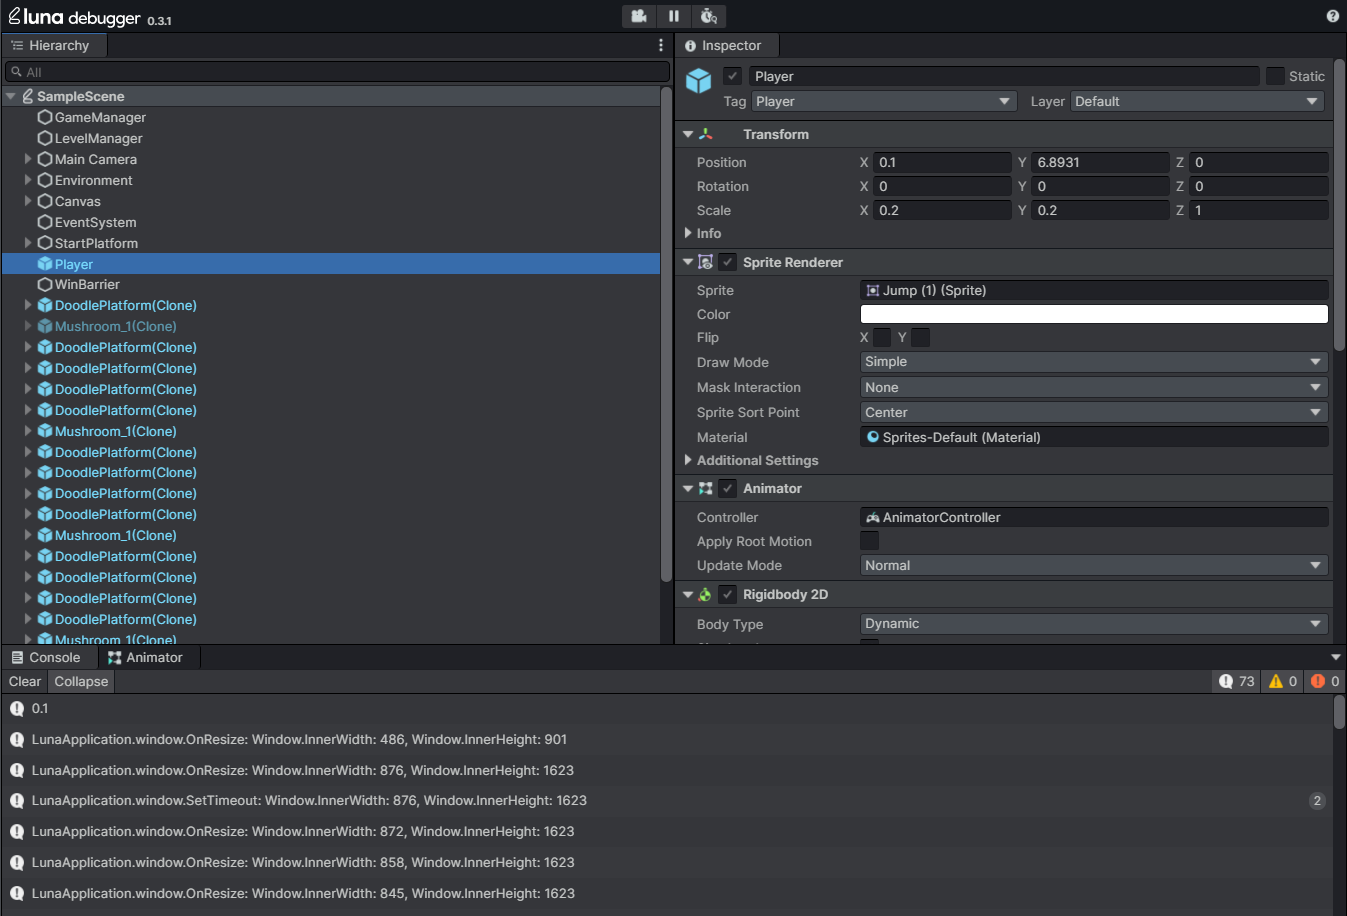
Once the Unity Playworks Plugin Debugger is displayed in DevTools, you should see the hierarchy and inspector panels populated with information related to your scene in the develop build. What youre seeing is a live representation of your builds object hierarchy in the Unity Playworks Plugin engine.
Additionally, most of what you see in the inspector panel is editable in real time and we provide tools to move freely around the scene and pause it.
Hierarchy Panel
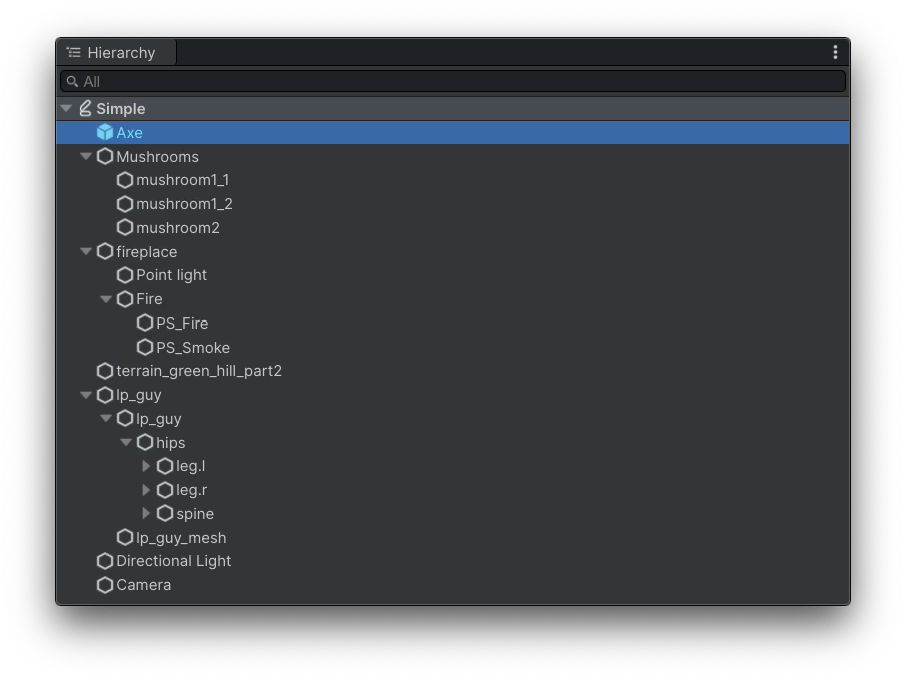 Here you can see the full hierarchy of all game objects in your exported build, you can click game objects to open them in the inspector panel and expand child objects. The hierarchy panel is useful for a number of reasons whilst debugging your build:
- Determining whether a game object is instantiated and active in the scene
- Determining whether a game object is a prefab
Inspector Panel
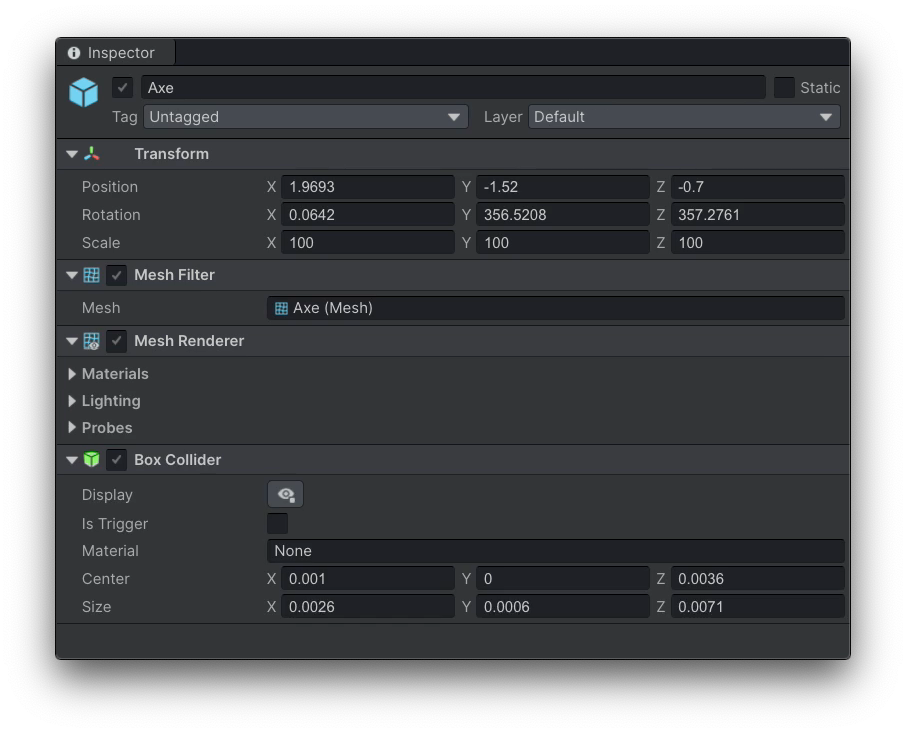 This is where youll find the values and attributes that apply to a game object in your scene. All the fields displayed in this panel are editable and any resulting changes can be observed instantly in the running scene. Viewing and editing game objects here can useful for the following reasons:
- Activating disabled game objects
- Changing the position, rotation and scale of an object
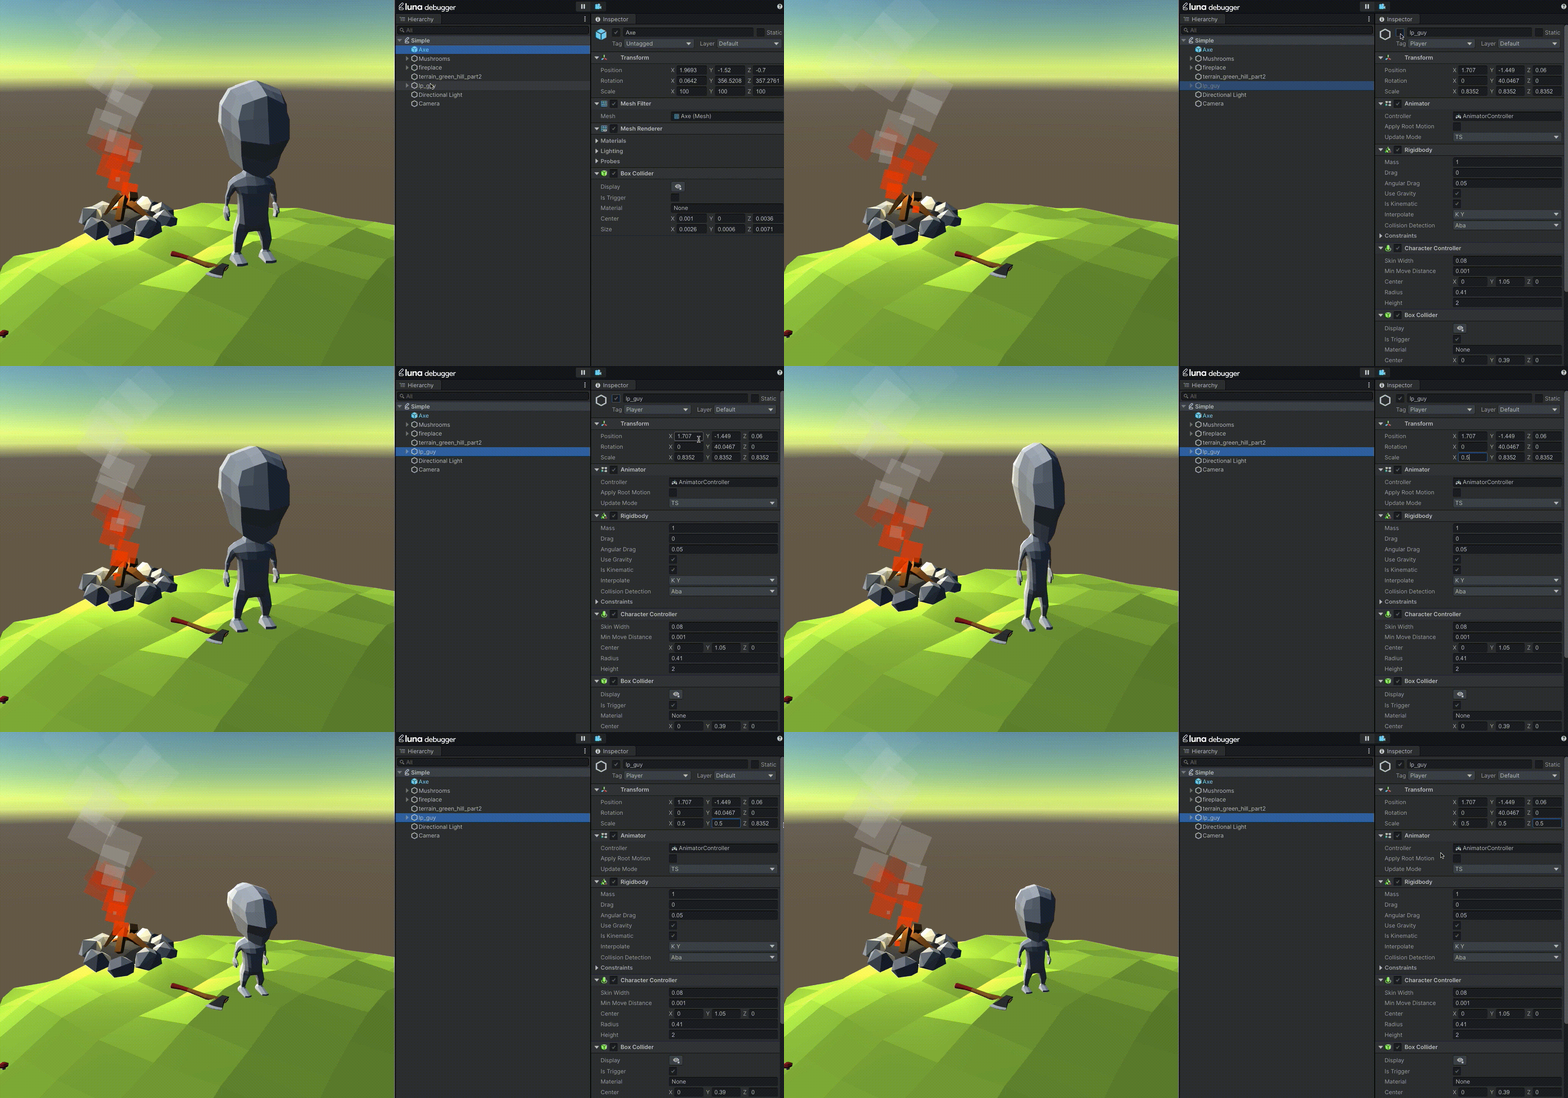 Change the layer of an object. This can be useful if something is not visible when you expect it to be, sometimes changing the layer can help you identify the cause.
Determining which components a game object has and which are disabled
Checking to see how a component behaves in the Unity Playworks Plugin engine when you change its values, so you can find the optimal configuration for Plugin
There are some limitations of the inspector panel and what we show there, those are detailed here.
Any changes that you apply using the Unity Playworks Plugin Debugger are not permanent and will be reset once you refresh or close the page. Changes are not written to your export and do not impact the final playable.
Console & Animator Panel
Under the Inspector and Hierarchy panels is where the Console and Animator panels can be found.
By default this section will display the console. The debugger console will act similarly as the one in Unity, showing you: logs, warnings and errors pertaining to your project. Some logs will link you to the GameObject in the hierarchy panel when clicking on them.
Clicking on a log type icon in the top right of the panel will filter out logs of that type from the console.
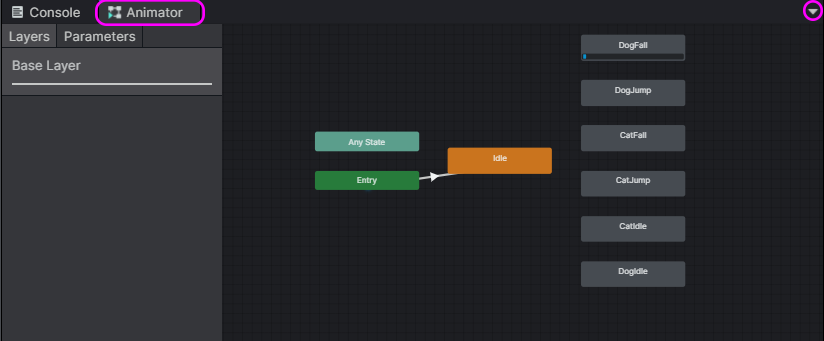
 The second tab in this section is for the animator, this will display the same animation graph you would see in Unity's animator panel. You can change what animation is shown by selecting the GameObject in the hierarchy that has the desired animation attached.
Resizing Panels
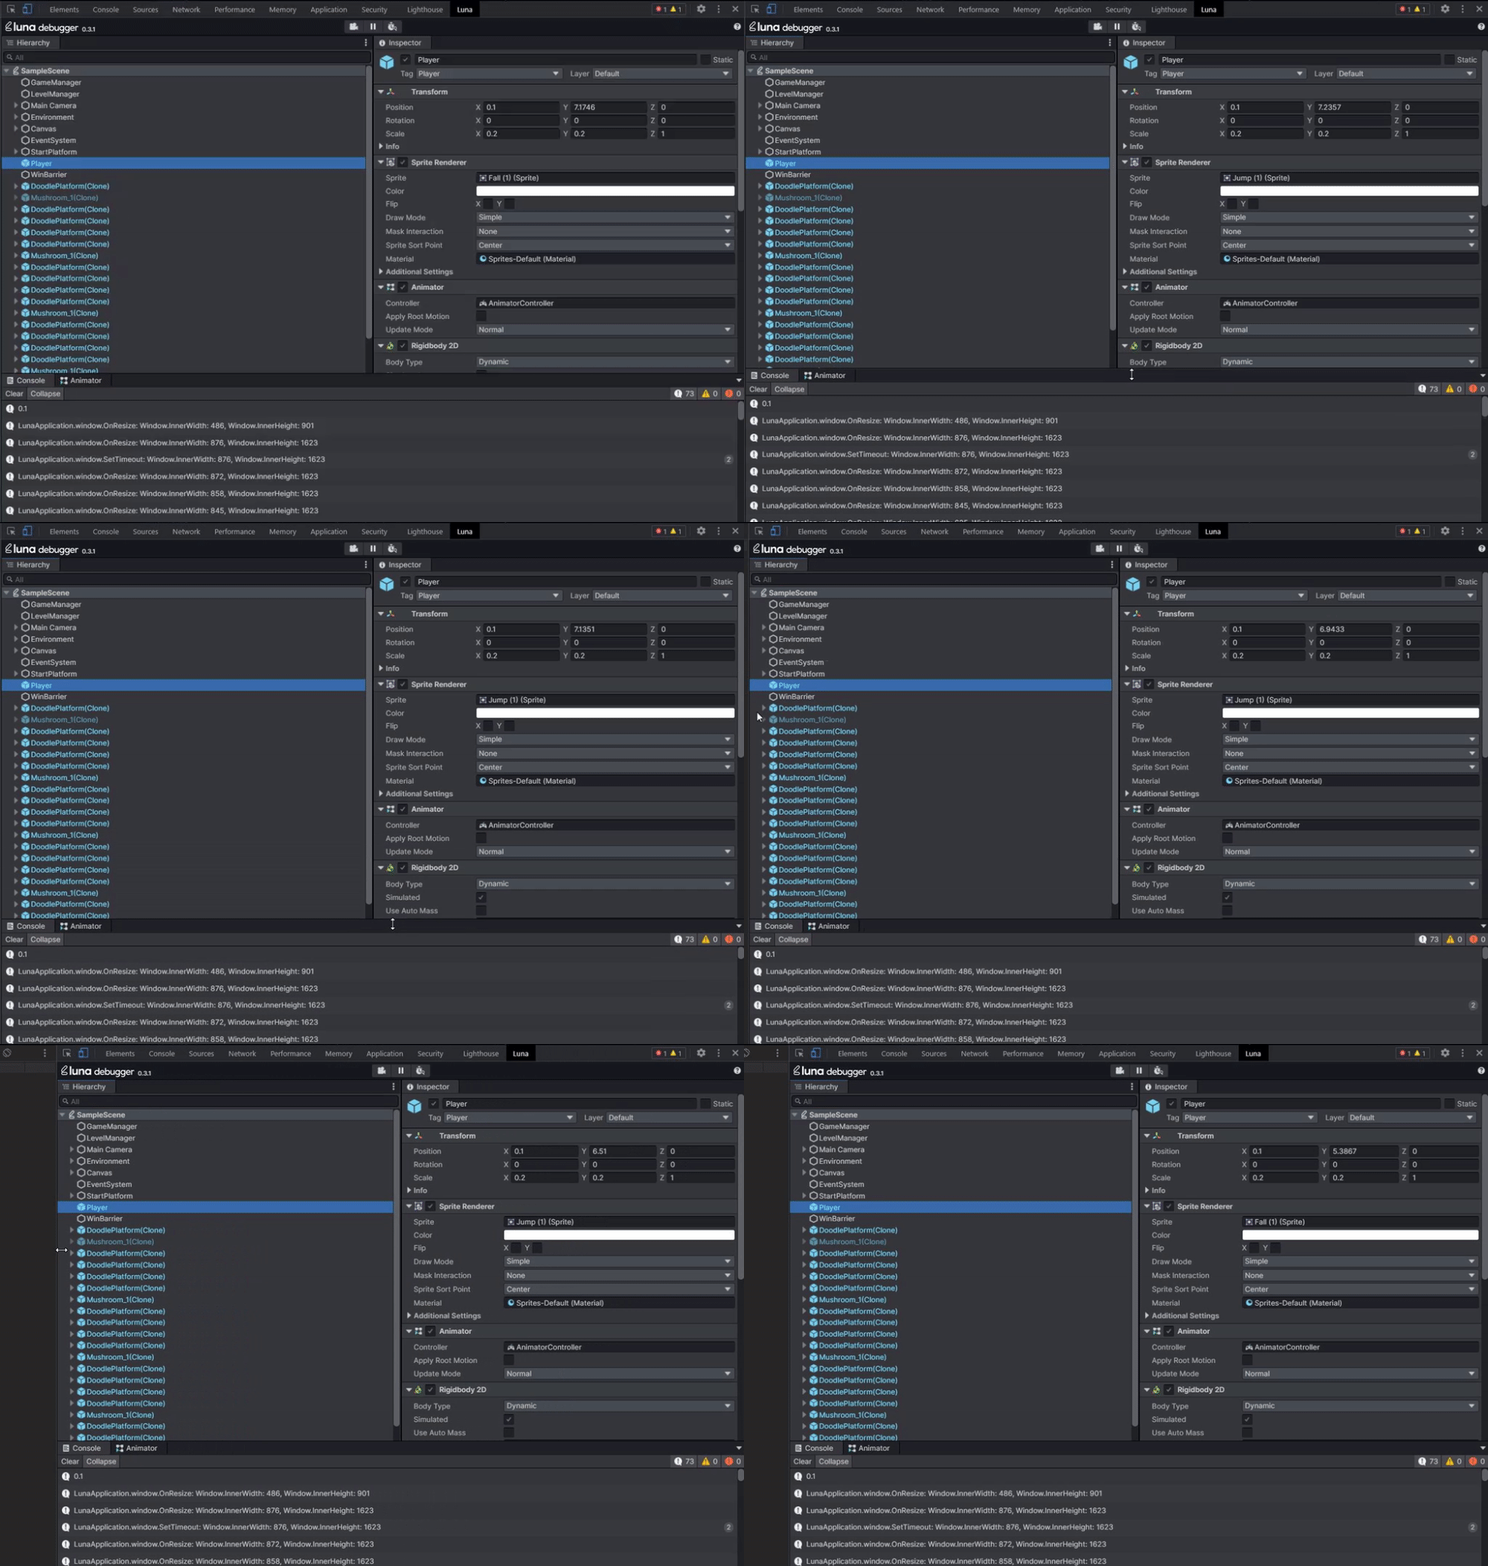
You can also resize the extension window to suit your needs:
Scene Camera & Scene Pause
 You can use the scene camera to move freely around a scene. Simply click the running scene and drag in the direction you want to move the camera in. Scroll to move the camera backwards or forwards or use the W, S, A, D keys, and the Q and E keys to move up and down.
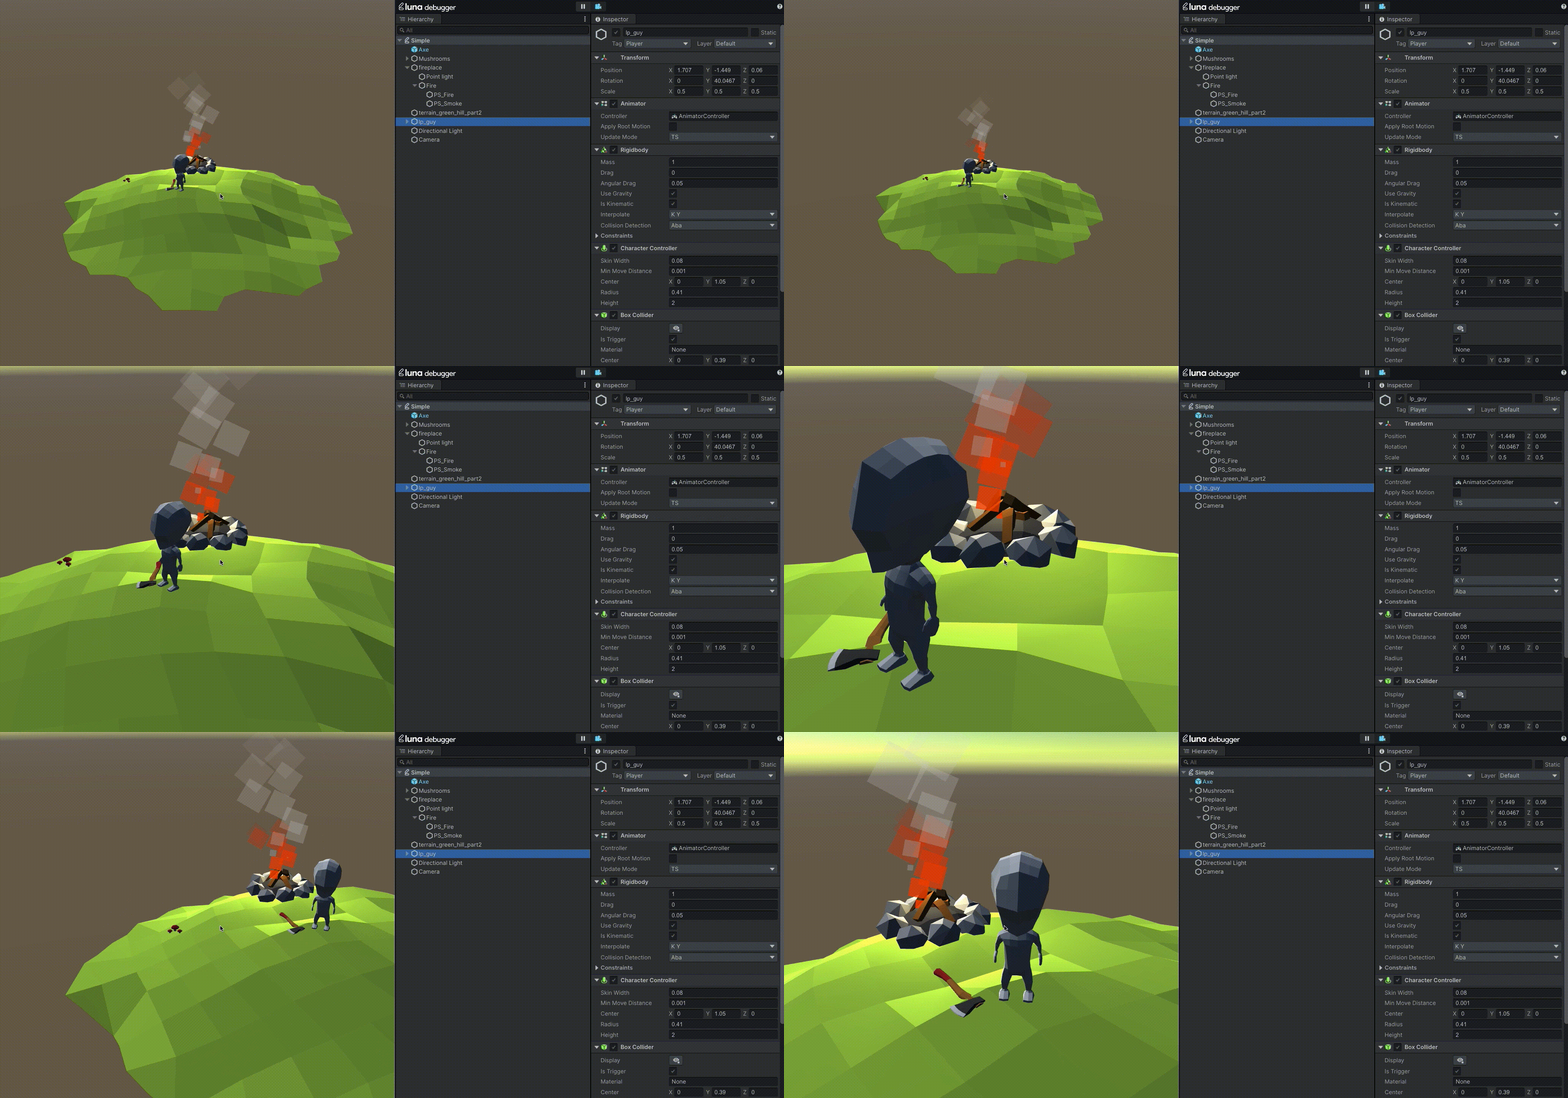 Pause can be used to stop the running of the scene arbitrarily and see the state of the scene in that frame.
Other features
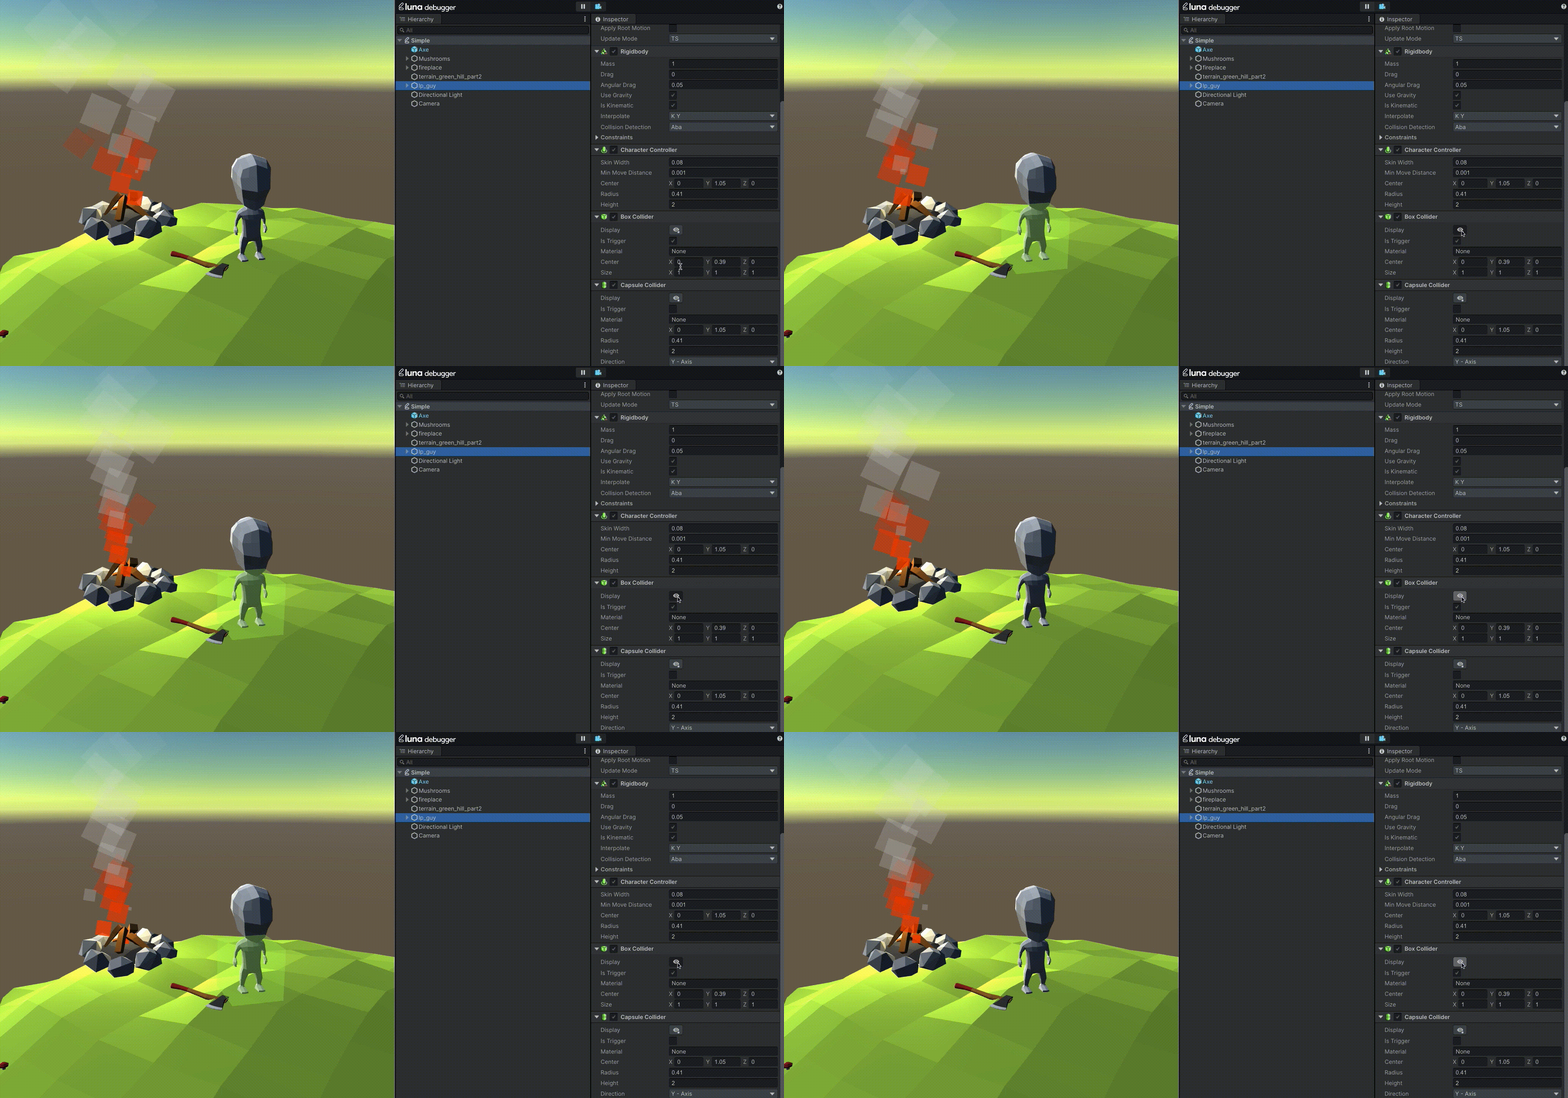
- Collider highlighting: You can use the debugger to highlight colliders in your scene so that you can identify their position, size and shape easily
Unity Playworks Plugin particle system support: In the inspector panel, if you are viewing a game object with the particle component used, we will highlight in red any features unsupported by the Unity Playworks Plugin engine
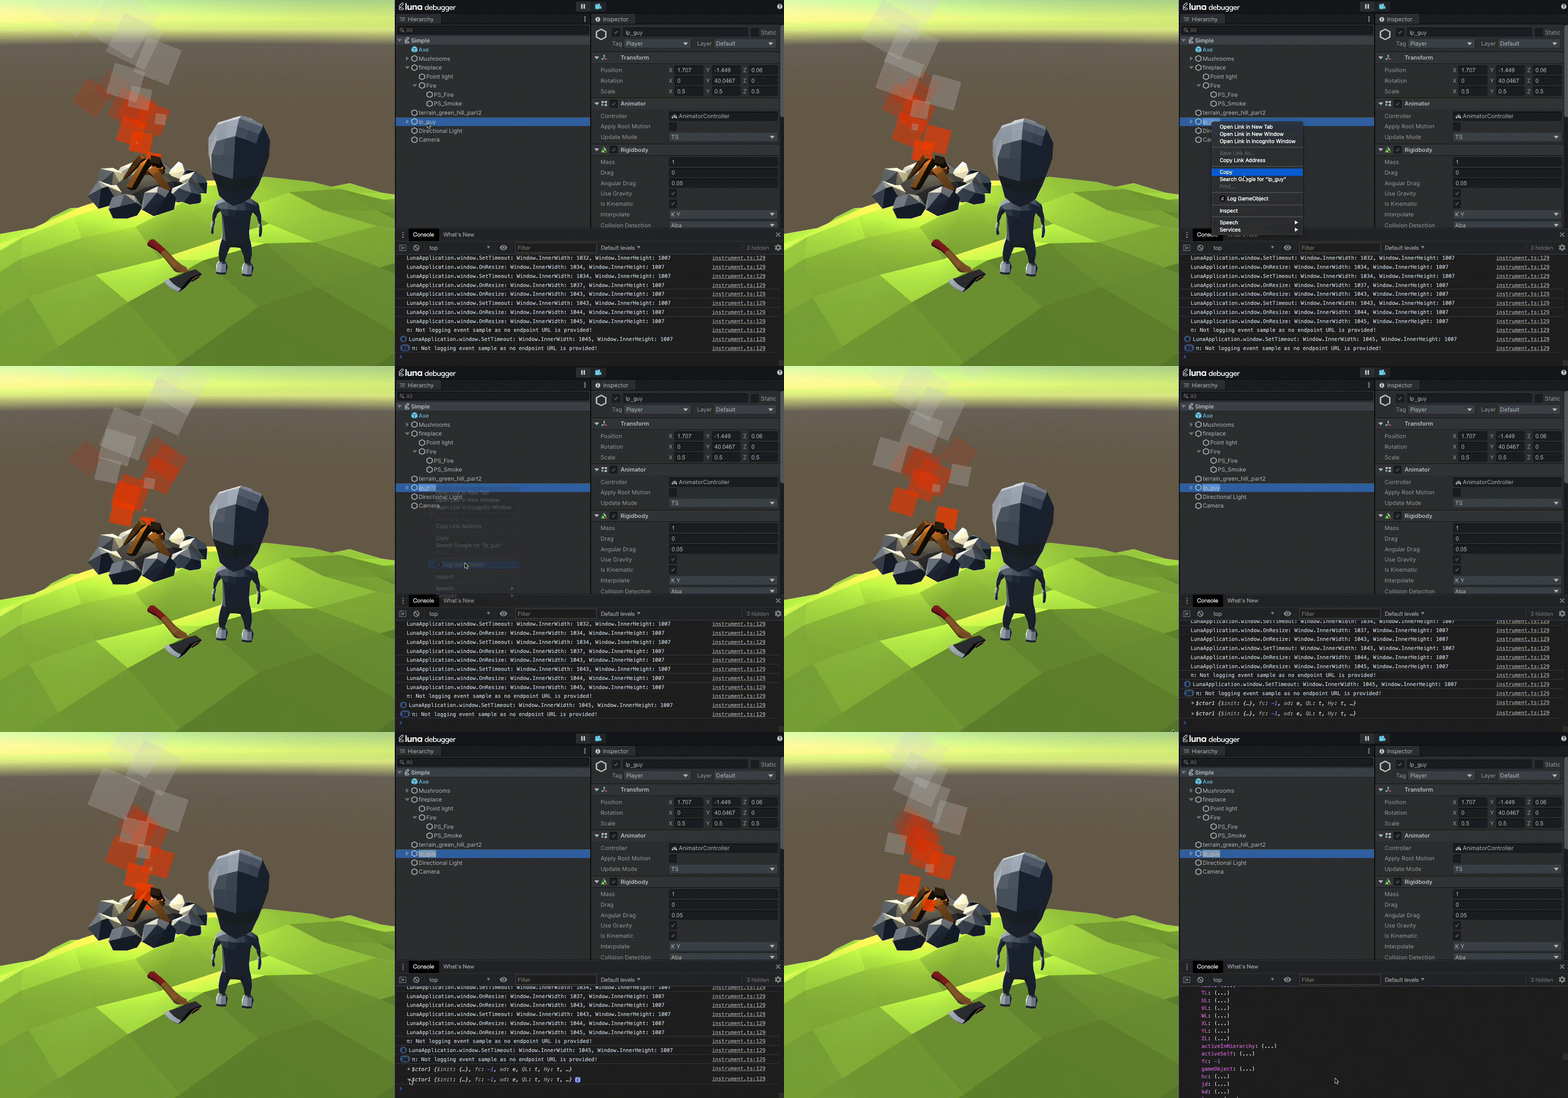
Game object logging: You can right click a game object in the hierarchy panel and log it to the console. This will log the entire object in JS to the browser's console.
Limitations
The follow component types are supported in the inspector panel:
- Int
- Float
- Boolean
- Text
- Layer
- Color
- Vector
- Rect
- Enum
- Curve (Not editable)
- ColorGradient (Not editable)
- AssetReference (Not editable)
- ComponentReference (Not editable)
Currently, the Unity Playworks Plugin Debugger has the following limitations to be aware of:
- Inherited fields in the Inspector panel are not properly ordered
- Enums are stored as integers for user-created classes
- Curves and colour gradient are not supported for editing
- In the particle system, angles are stored and displayed as radians instead of degrees