Js Profiler
Chrome DevTools provides a profiler for the Chrome browser, which gives developers a way to analyse the performance of their playable ad in the browser.
You are able to check a variety of events and data from your scene at runtime or during loading in order to identify potential issues, drops in performance and benchmark your playable.
Record Runtime Performance
Once selected, the performance tab should show the profiler in the chrome window. There are some steps you need to do in order to start capturing profiling data.

- In DevTools, click the Record option (first left option). DevTools will then capture performance metrics as the page runs.
- Interact with the page, or wait a few seconds for the data to capture the sequence you want to analyse.
- Click Stop when the sequence is finished. DevTools will stop recording, process the data and then display the results on the Performance panel.
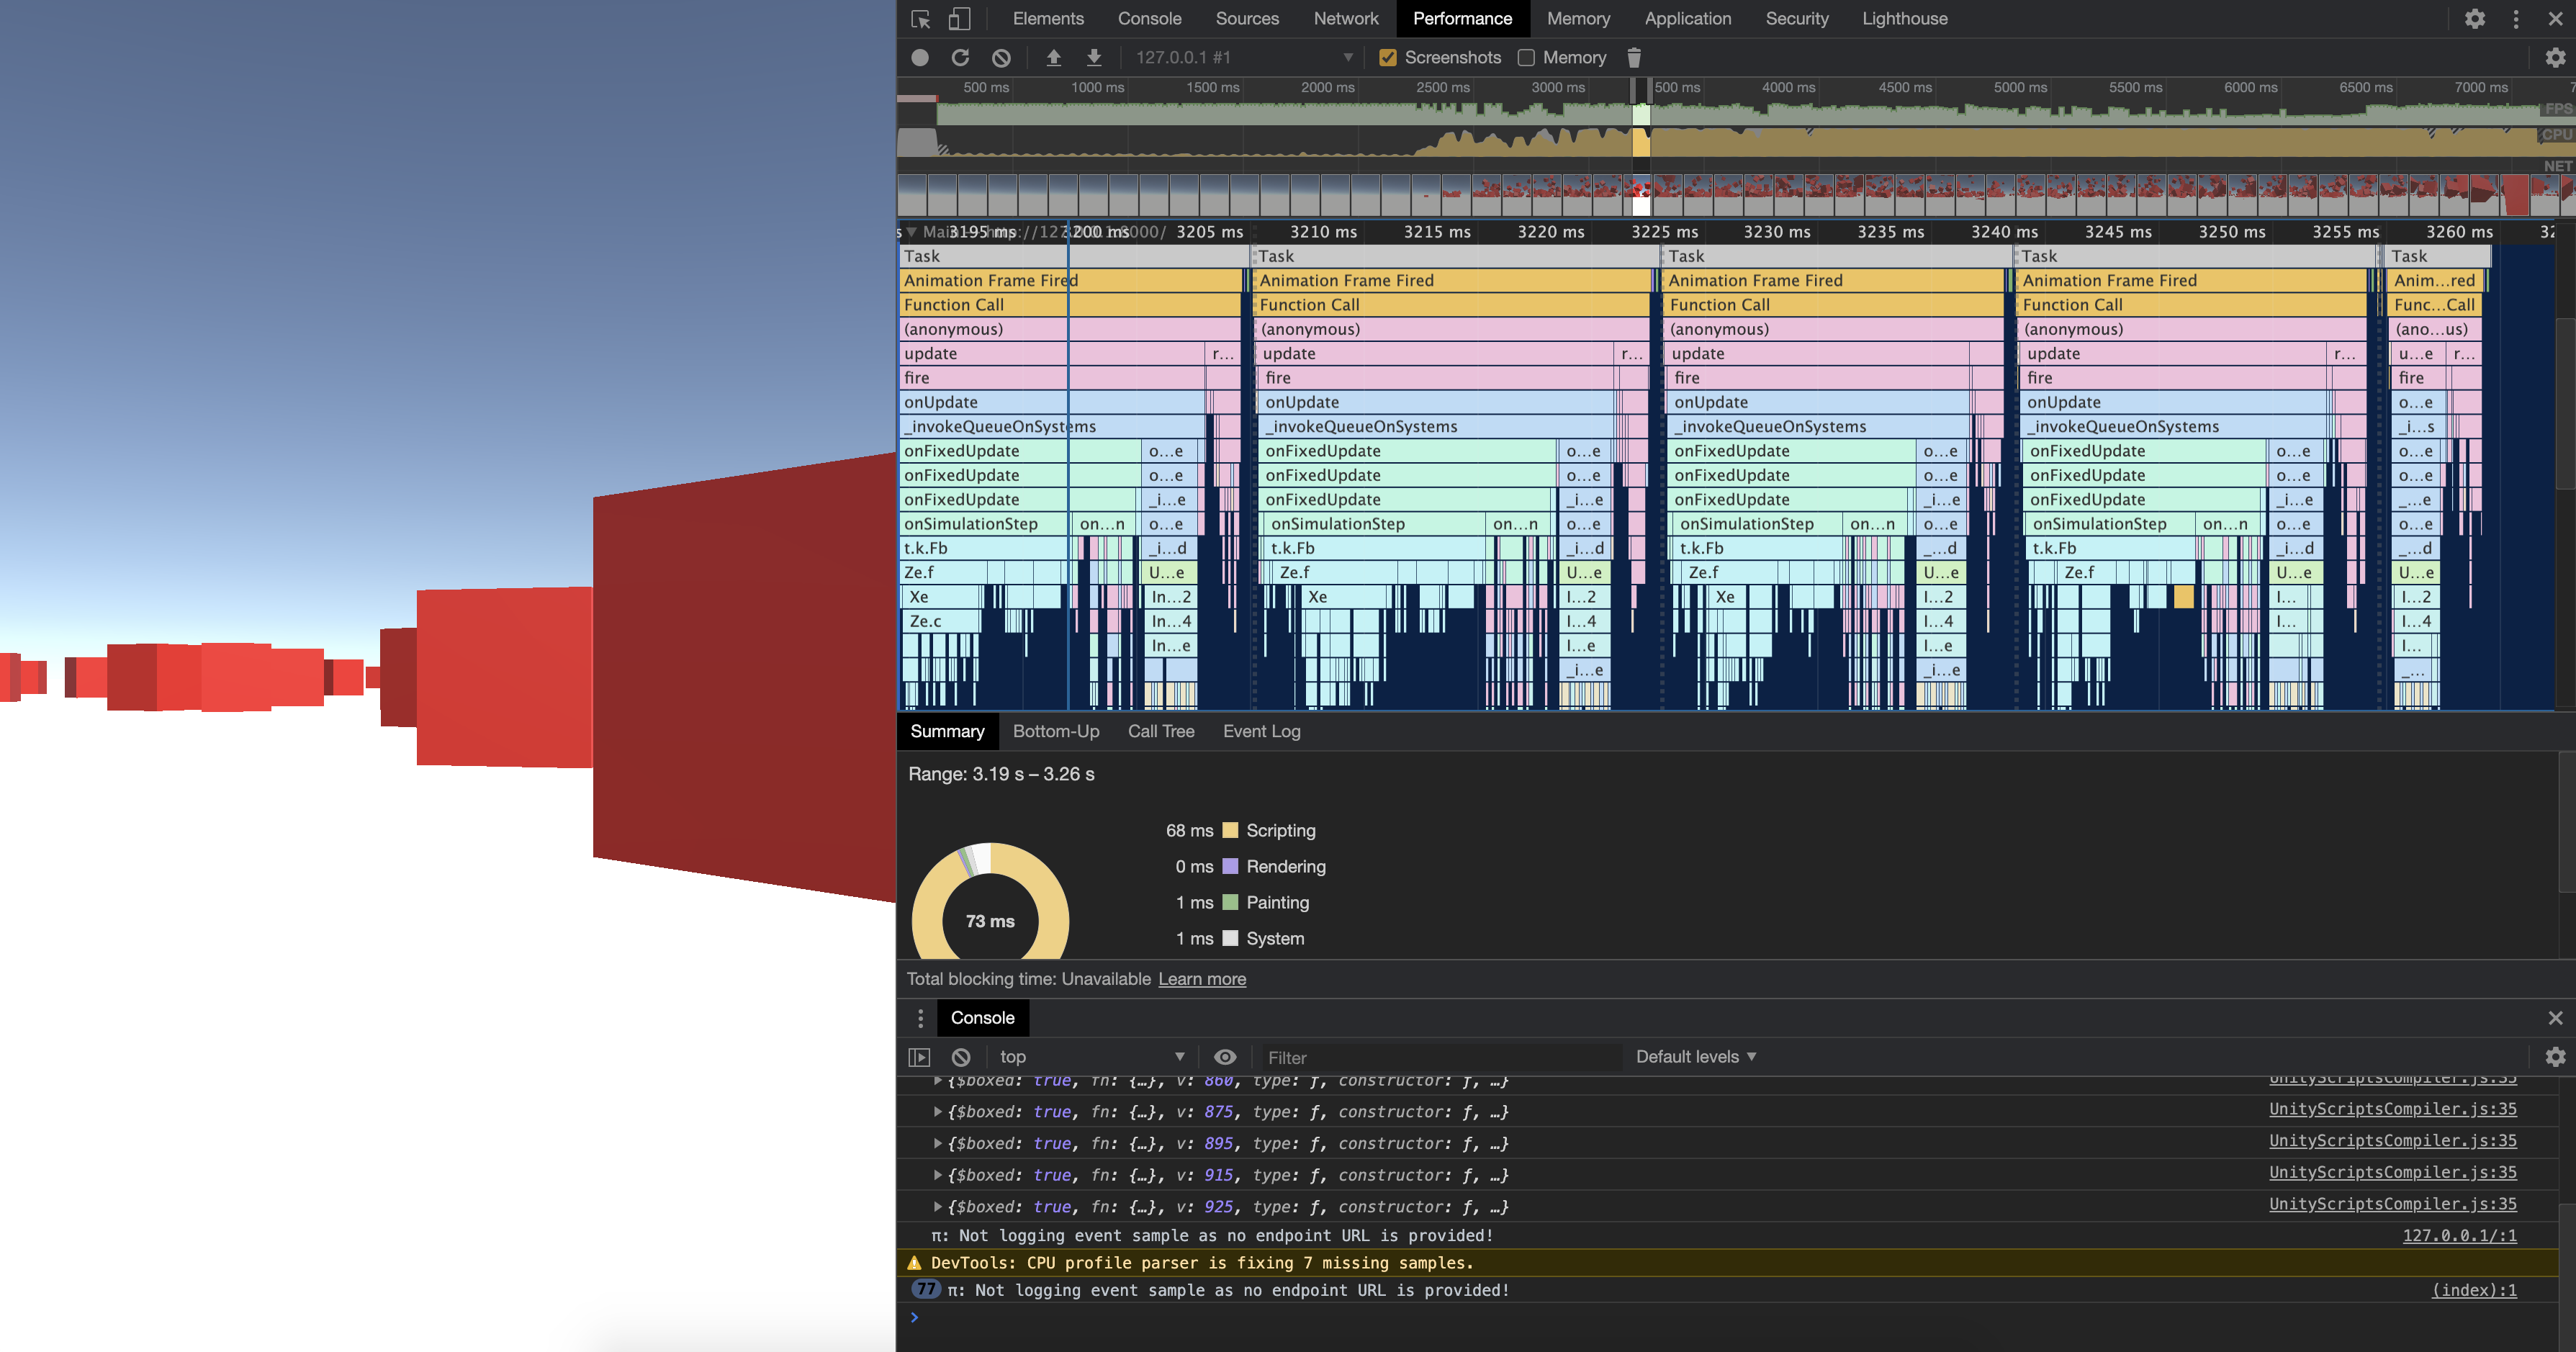
Once the Performance tab is selected, and a session recorded, here is what a typical view may look like.

Record Performance
The profiling in Unity may not show performance issues with scenes but when converted and run in HTML5 it can be apparent that some gameplay is not very performant and slow.
DevTools allows you to identify which part is performing poorly much like the Unity profiler.
Chrome Profiling: Example
Recorded profiles show a timeline that can be used to narrow down the data to a specific area of information, allow for finer look into the calls like rendering, events, functions and time-taken to perform actions.

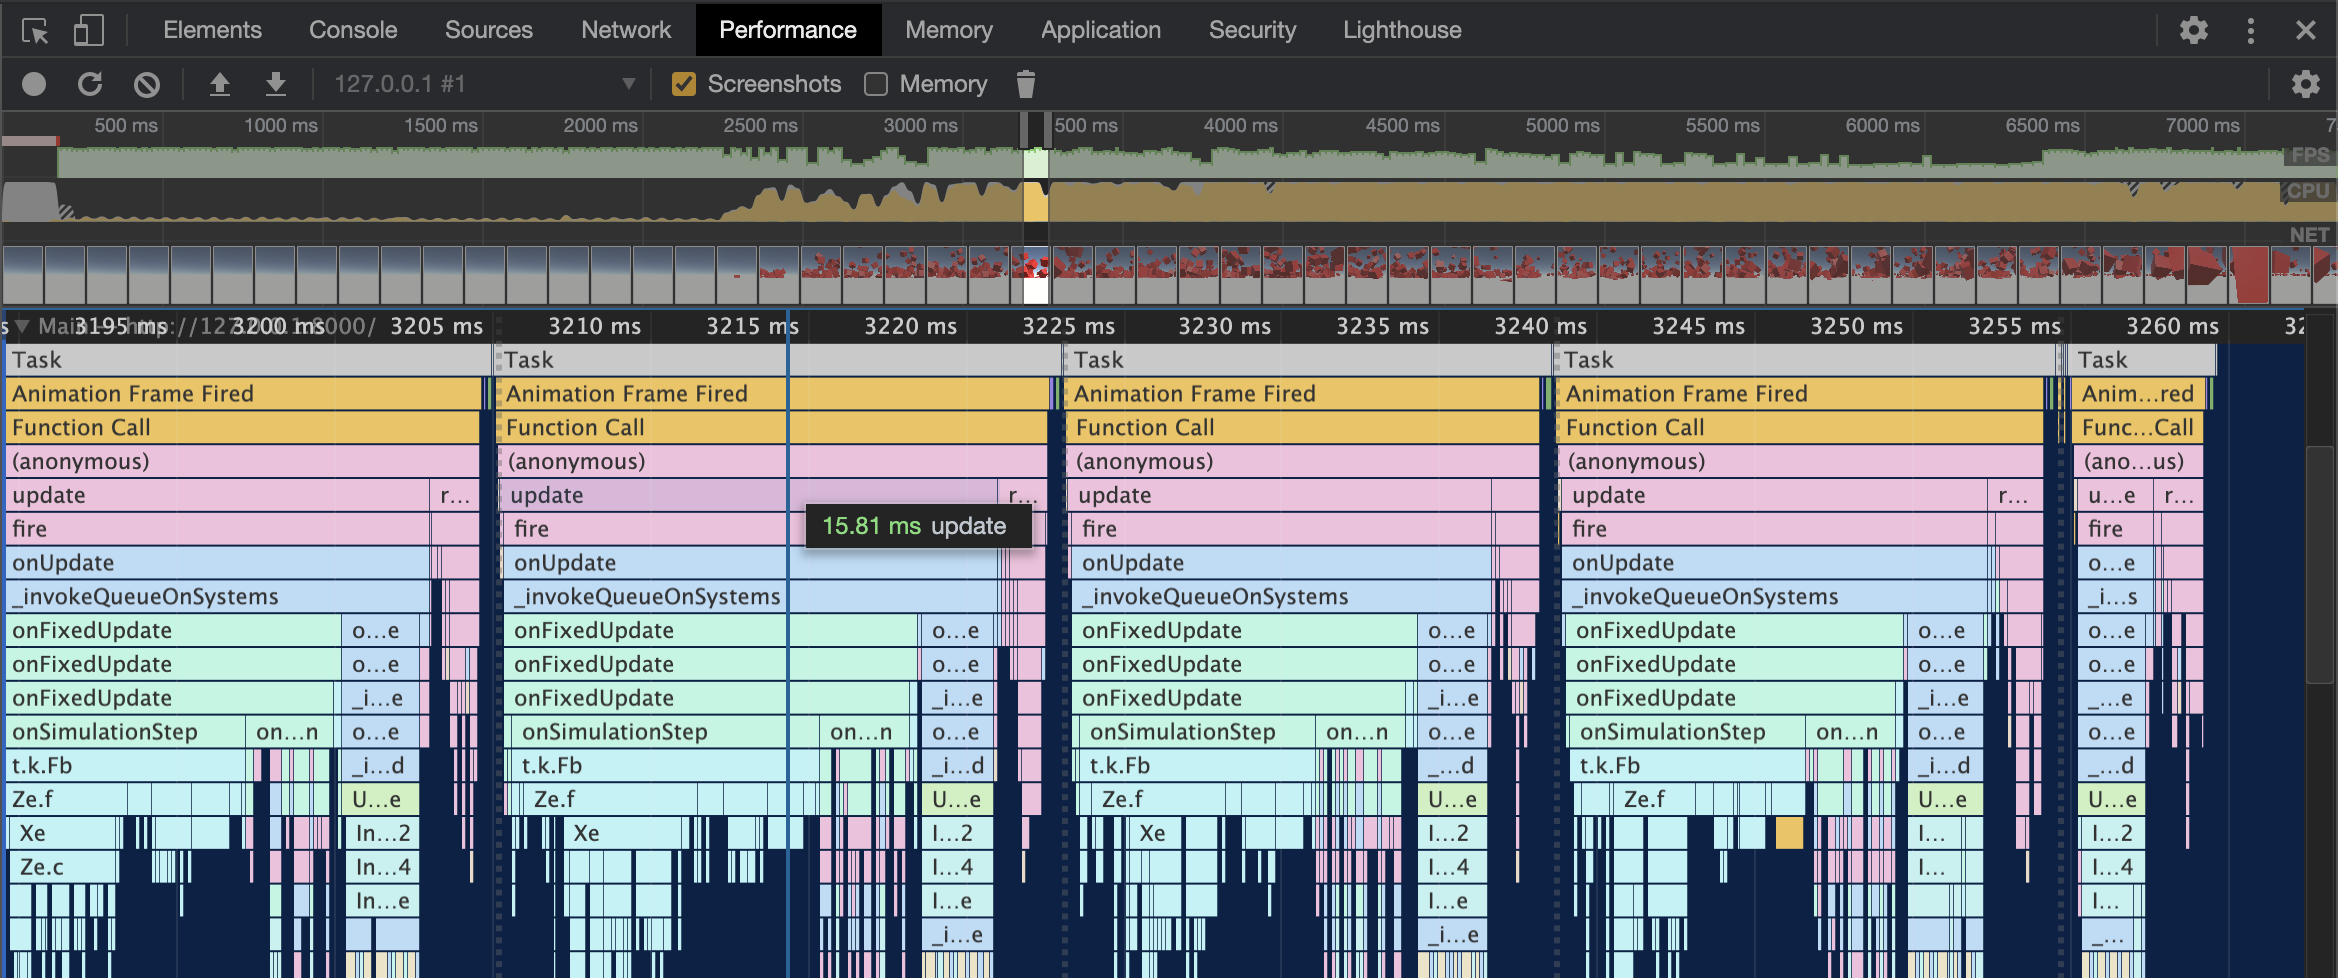
In the image below Animation Frame Fired and Function Call is causing a drop in performance, as these are taking a long time to execute, which is slowing down the pace of the ad gameplay. In these situations you want gameplay to be a fluid as possible!
Here we have an animation event and function call that is causing a slow in performance due to the time-taken to perform these calls, but identifies what the issue is in terms of where begin to reduce this time delay and improving performance.

The Views are from a specific analysing tab which is:
- Main
The main tab represents the main thread activity with a Flame chart. The x-axis represents the recording over time. The y-axis represents the call stack. From top to bottom, the events on top cause the events below it.
- Flame Chart
The Flame chart as described above shows the call stack and events. These events can be clicked and viewed in the activity table for specific events information inside the call stack.
Analysis of the cause
To understand why this happens, the effects of running your code in a different environment needs to always be in consideration.
Following the Flame chart down the execution order it helps to identify where the problem origin is. In this case somewhere during animation call and a specific function call.
The solution for this example is that the Instantiation of the Cube objects followed by a FindObjectWithTag call, causes a time-consuming and slow process of searching the scene and creating many objects at the same time, especially if you then Destroy these objects.
A general point of advice is to avoid these kinds of issues by not using methods that require such resource expensive calls or require a large amount of draw calls in an update method.