Project Diagnostics
Project Diagnostics can be found within the Build and Upload tab of the Playworks Plugin.
This is where you can find all project errors, warnings and suggestions displayed in an easy-to-navigate and categorised way.
This works together with PHC (Playable Health Check), a checklist present in the Upload to Unity Playworks tab which will point out your project health status and what can be improved.
When to use it
Project Diagnostics aims to streamline the debugging experience with Playworks Plugin : After building the diagnostics window will display any pertinent warning/error messages based on that build's outcome.
It's also a useful way to view the compilation status without having to compile your project or switch over to your IDE.
These messages can be double-clicked to take you to where in your scripts we believe the problem is originating. You can also click on the error code at the beginning of diagnostic messages to be taken to the relevant documentation page here, which will in turn direct you to possible fixes.
How it works
To analyse the solution, Diagnostics will construct the solution file in the same way as the build process but rather than compiling it to JavaScript, we instead analyse the project with Roslyn to quickly obtain all compilation information.
Diagnostic logs are grouped by categories:
| Category | Description |
|---|---|
| Ad Network | This category will give you an indication if the current project is compatible with all ad network requirements, such as the required API call are used. Fixing all of these issues mean your playable ad will be accepted by all of our supported ad networks. |
| Best Practises | This category checks for our best practises, such as usage of LunaPlaygroundFields or Custom Events API's. Our data has shown that a playable implementing all of our best practises perform better on ad networks. |
| Core Functionality | This category checks for issues that can break the playable ad for unexpected behaviour. For that reason, it is extremely important to fix these issues. They may include compiler errors or usage of a reserved keyword which is known to break the playable ad during runtime. |
| Technical Performance | This category checks for issues related to runtime performance, which might break the playable during runtime. Our data has shown that runtime performance is also related to a better performing playable ad, and in some cases, ad networks reject the playable if the runtime performance is too low. |
Any errors you see in this panel regarding the UnityEngine namespace, actually refer to our version of UnityEngine and therefore highlight compatibility issues between your project and Unity Playworks Plugin.
Diagnostics UI guide
1. Build button options & Previewing
At the top left of the Diagnostics window is the 'Build project' button.
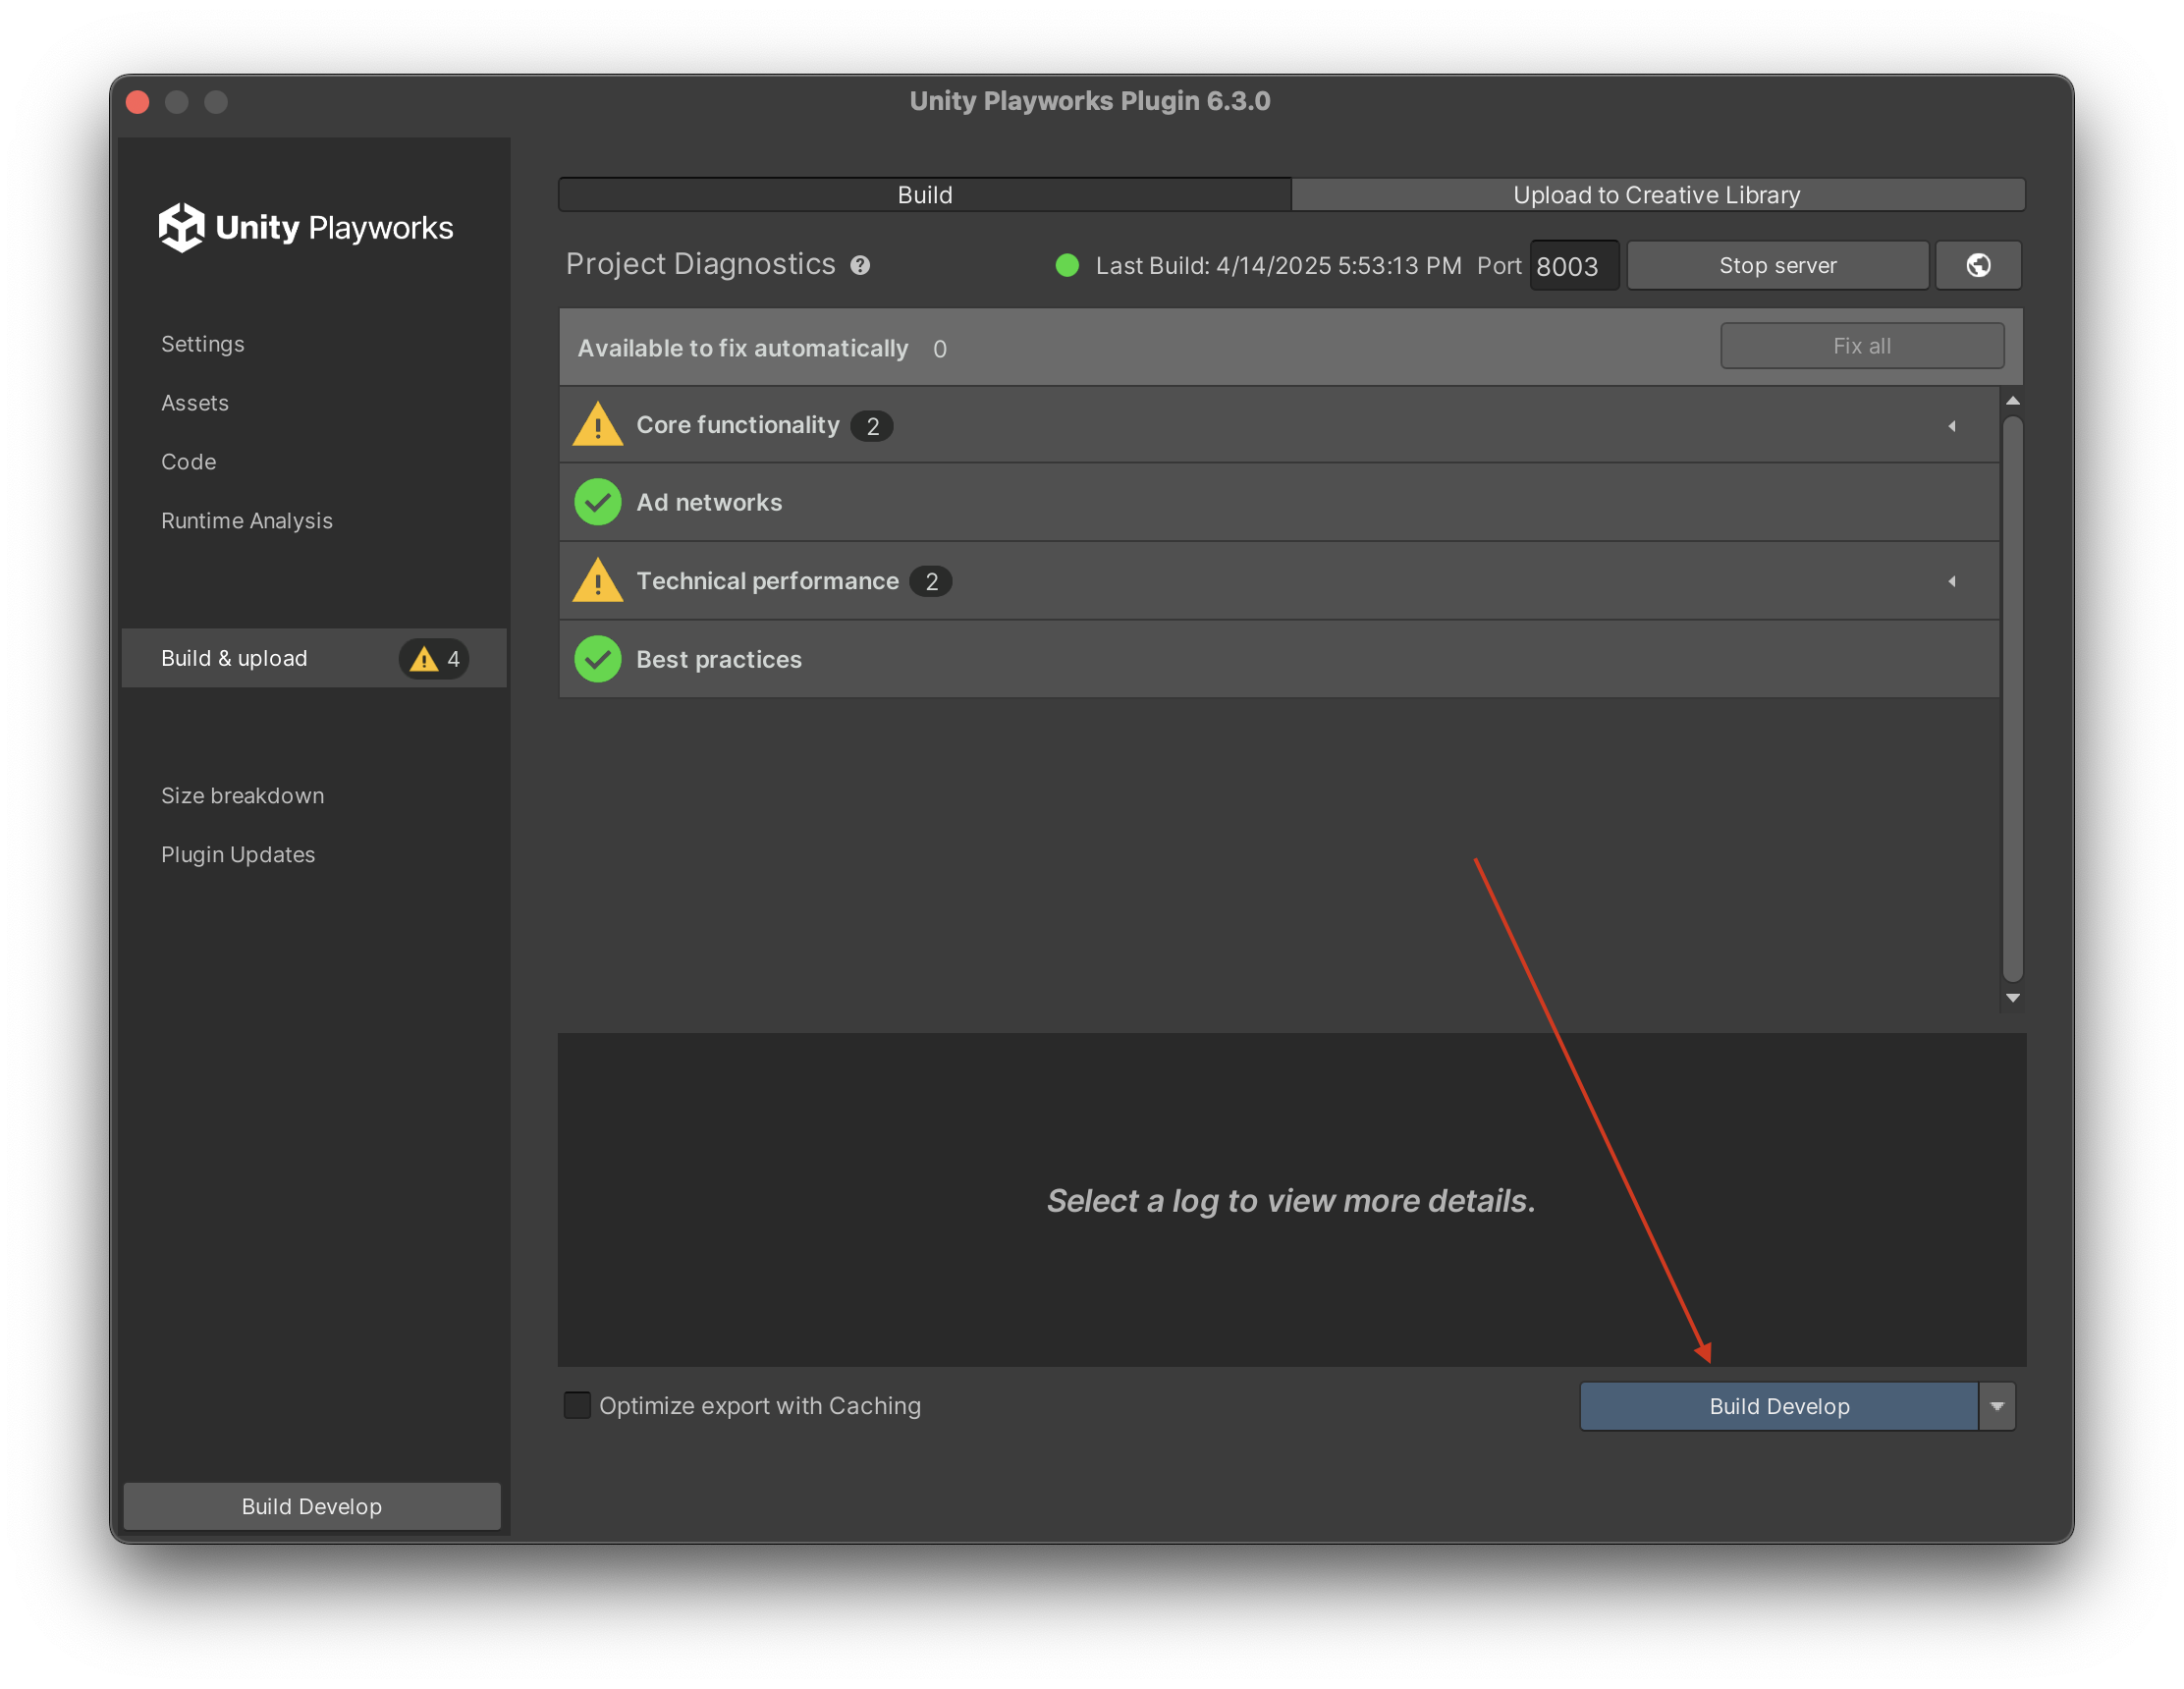
This button also provides a drop-down of different compilation options:
- Build project: This will begin the process of creating a develop build. (You can preview a develop build in your browser via the post-build prompt options, or the 'Start server' button near the top right of the window)
- Build project (asset only): This option is available from Playworks Plugin 3.3.0. It will be automatically selected when the Optimize export with Caching option is enabled and any asset of your project including Unity Playworks Plugin settings was modified.
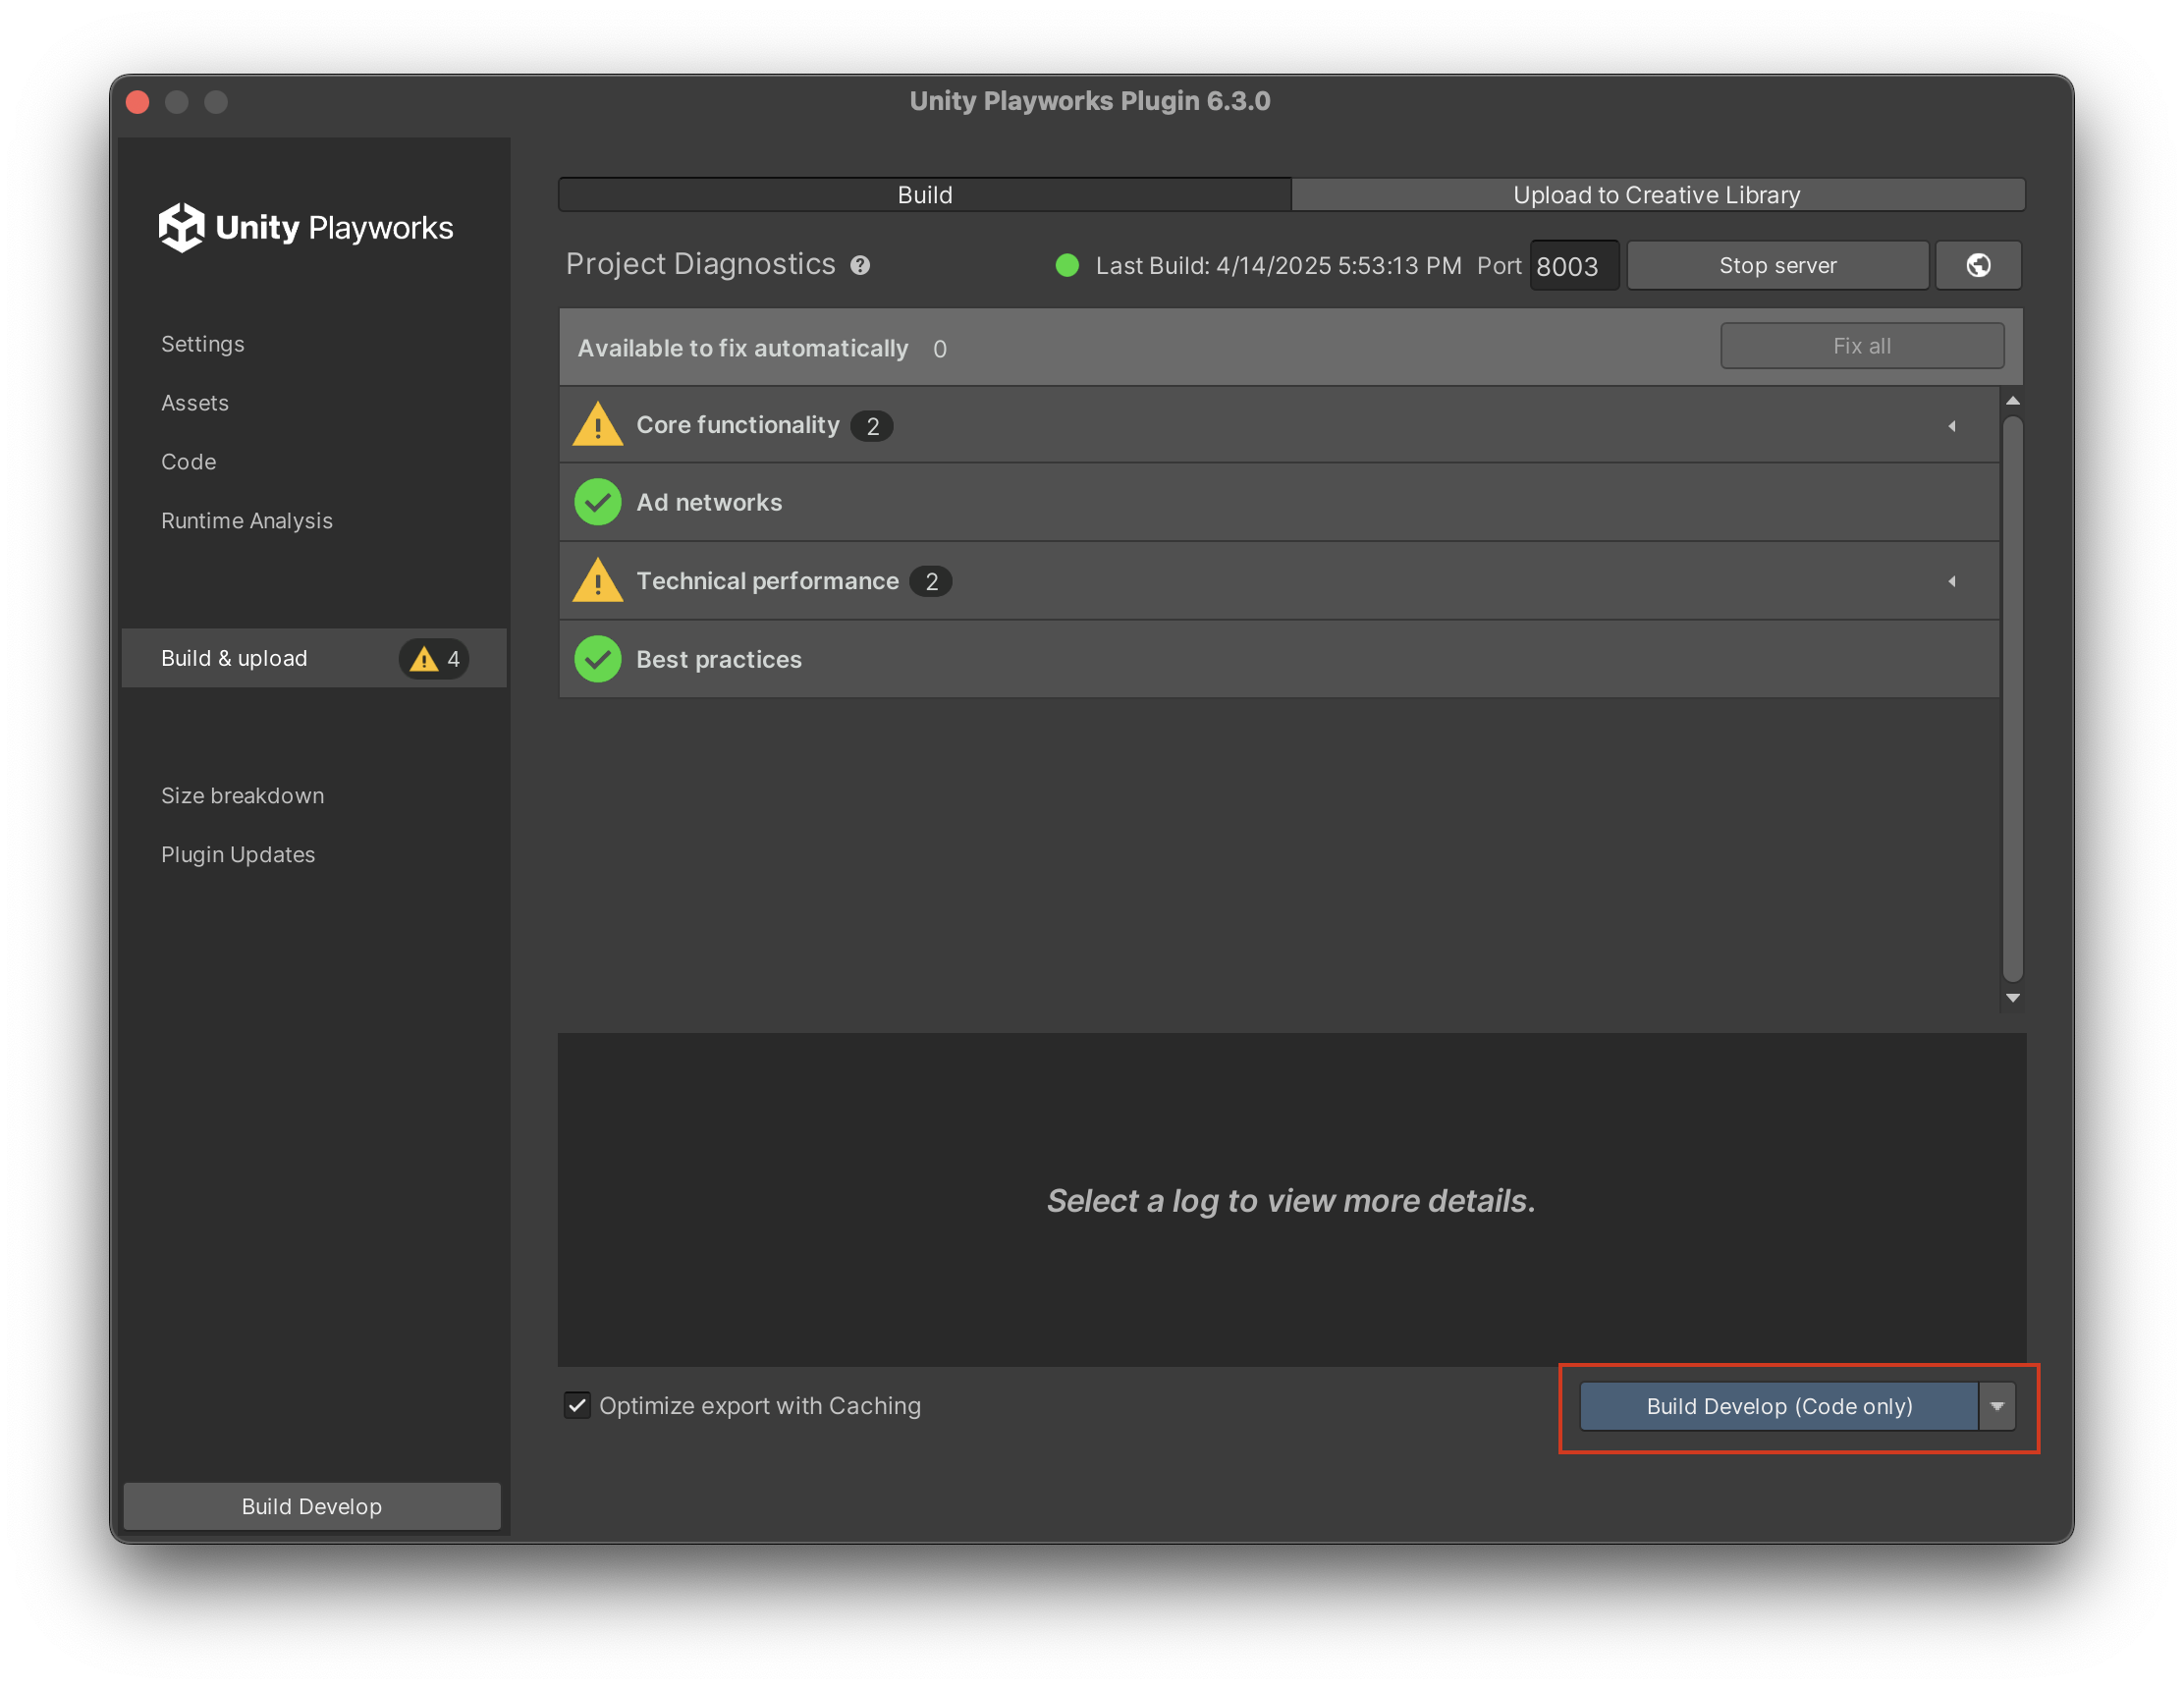
- Build project (code only): This option is available from Playworks Plugin 3.3.0. It will be automatically selected when the Optimize export with Caching option is enabled, your code was modified, or you made changes to settings in Code section.
- Assets diagnostics: This will recompile only your playable's assets, and filter the logs to only pertain to said assets.
- Code diagnostics: This will recompile only your playable's custom scripts, and filter the logs to only pertain to said scripts.
- Open in Browser: This option is available from Playworks Plugin 4.2.0. It will be automatically selected when the Optimize export with Caching option is enabled and you havent done any changes in your project since your last succeeded develop build.
By default, the button will be set to 'Build project'.
2. Optimize export with Caching
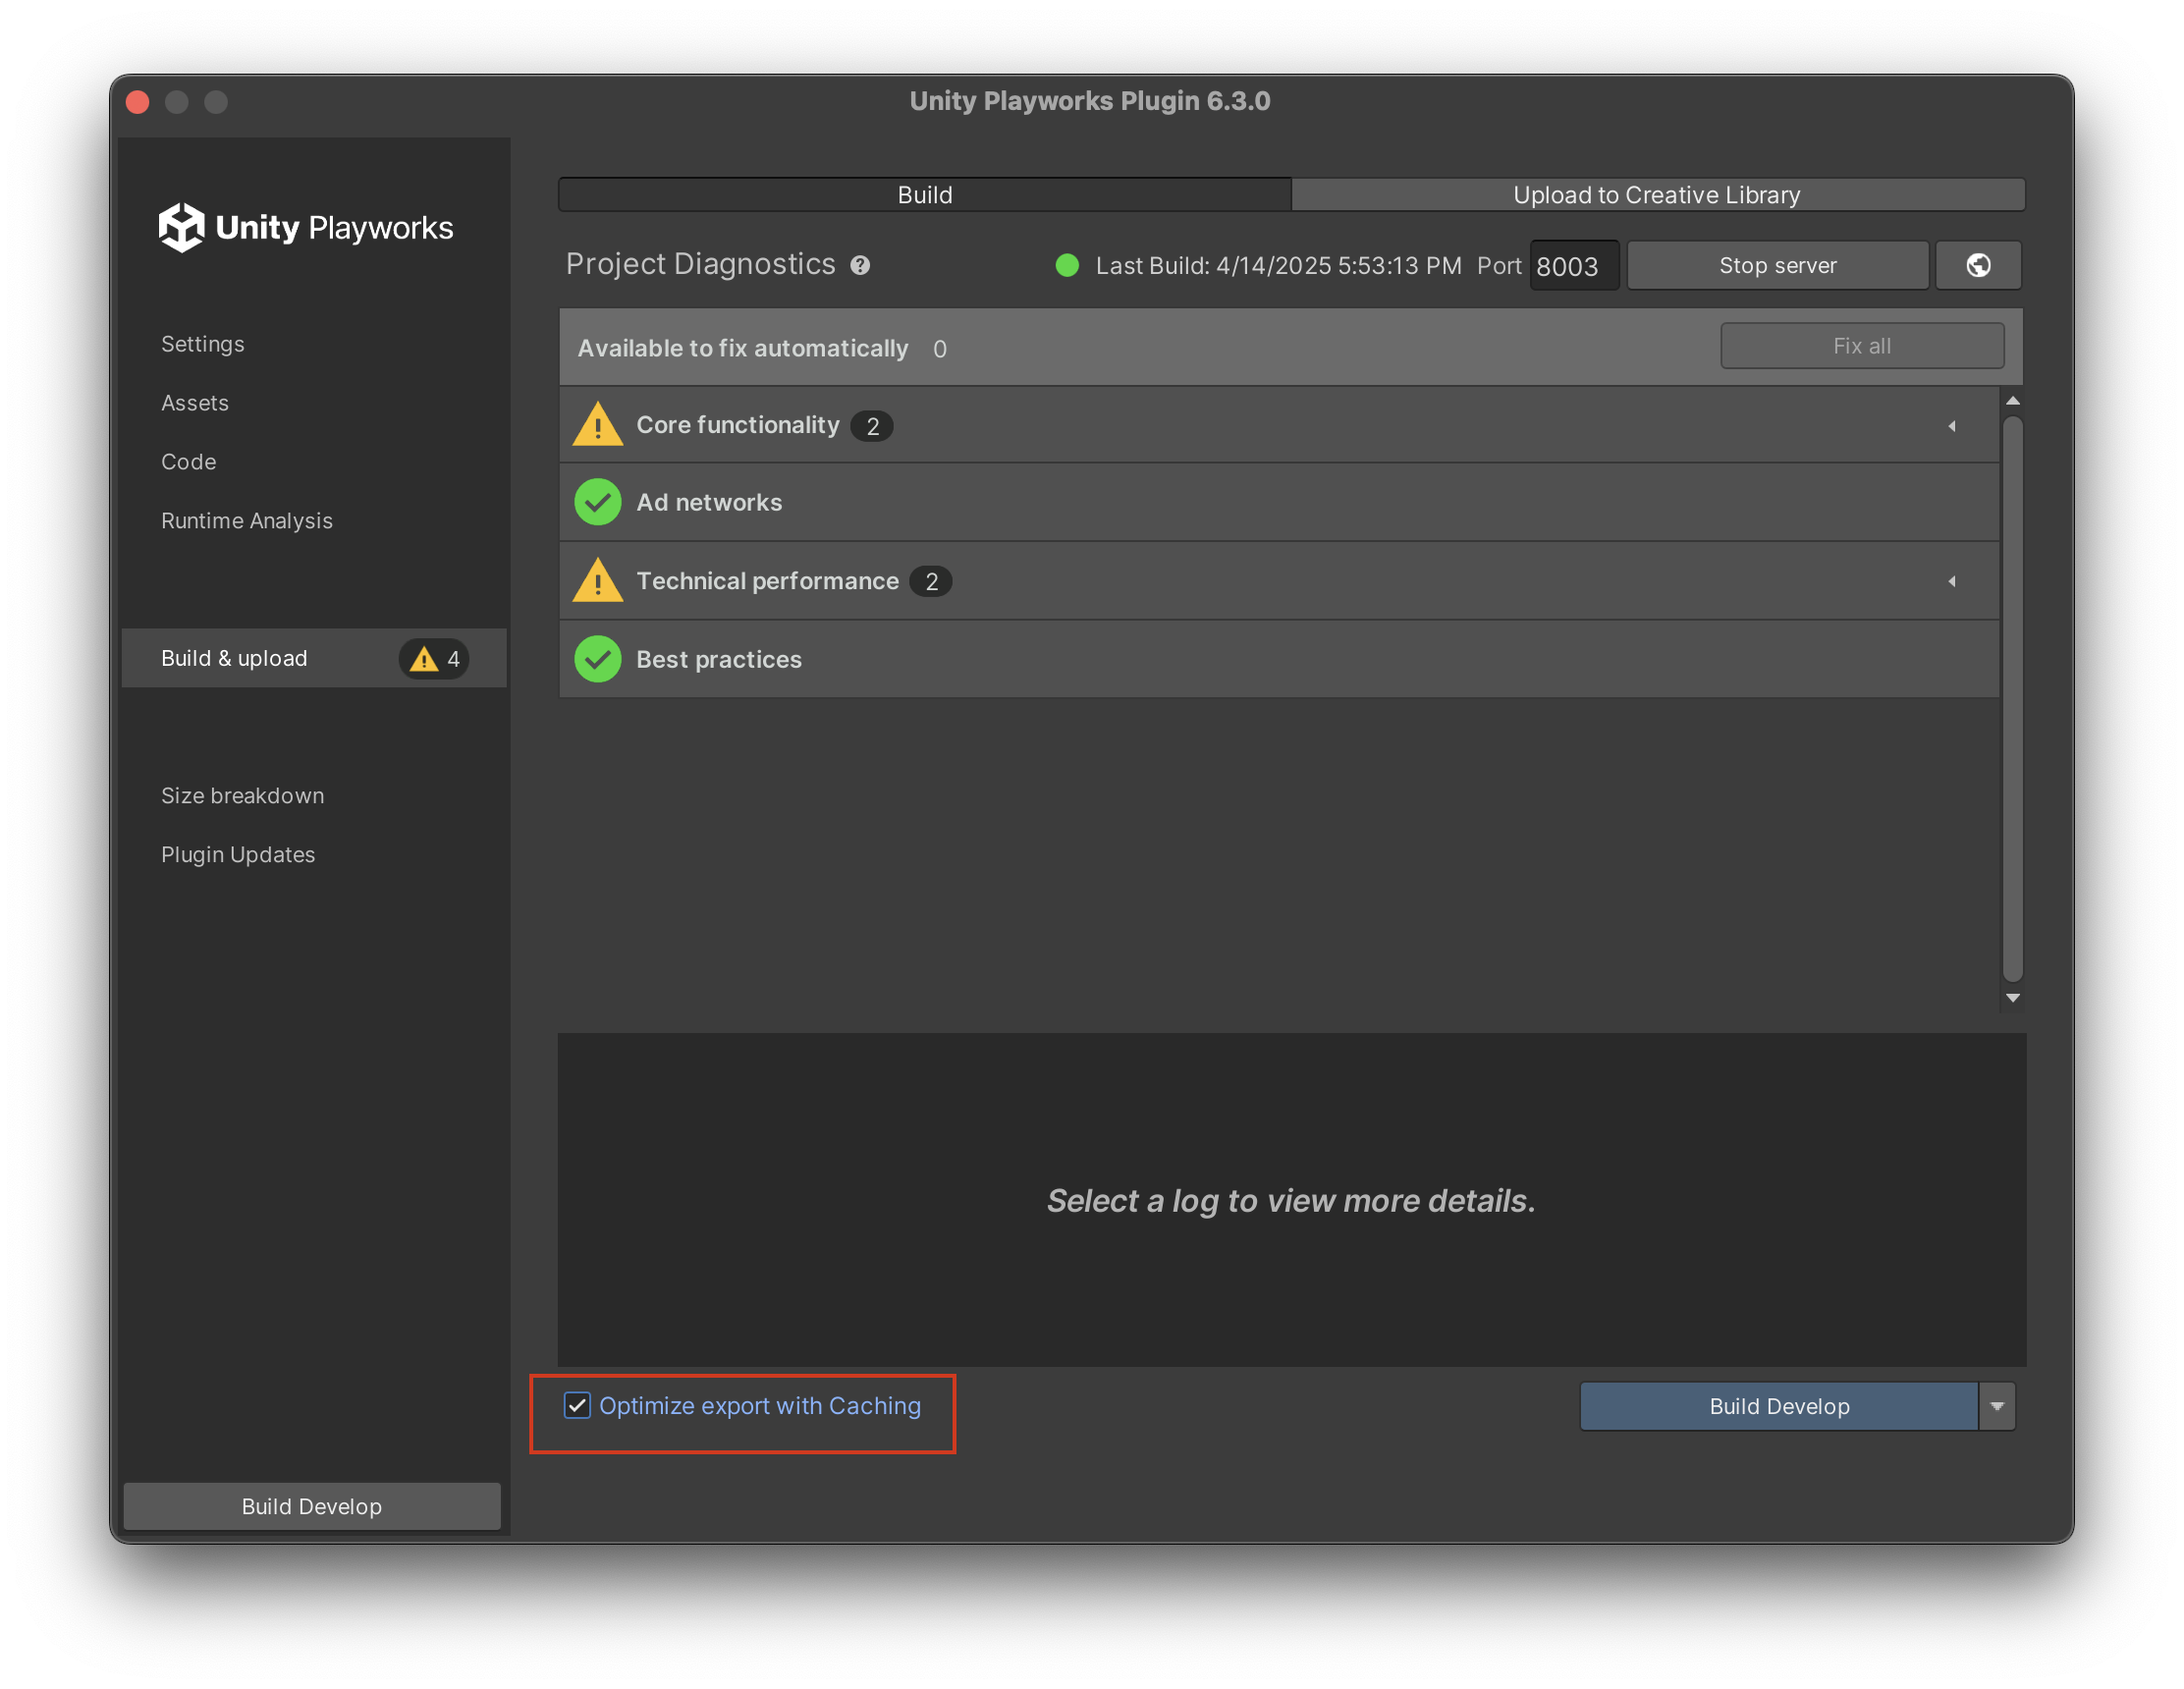
This functionality is automatic. Depending on what is changed in your project (code or assets), if the Optimize export with Caching checkbox is activated, it will change the build type to either export code, or assets only. Starting from Playworks Plugin 4.2.0 the Open in Browser button will replace Build Develop button if you havent made any changes to your project, but if you did and cache gets dirty, you can revert those changes to bring back previous state of the Build button.
After building develop Open In Browser button automatically shows up as below:
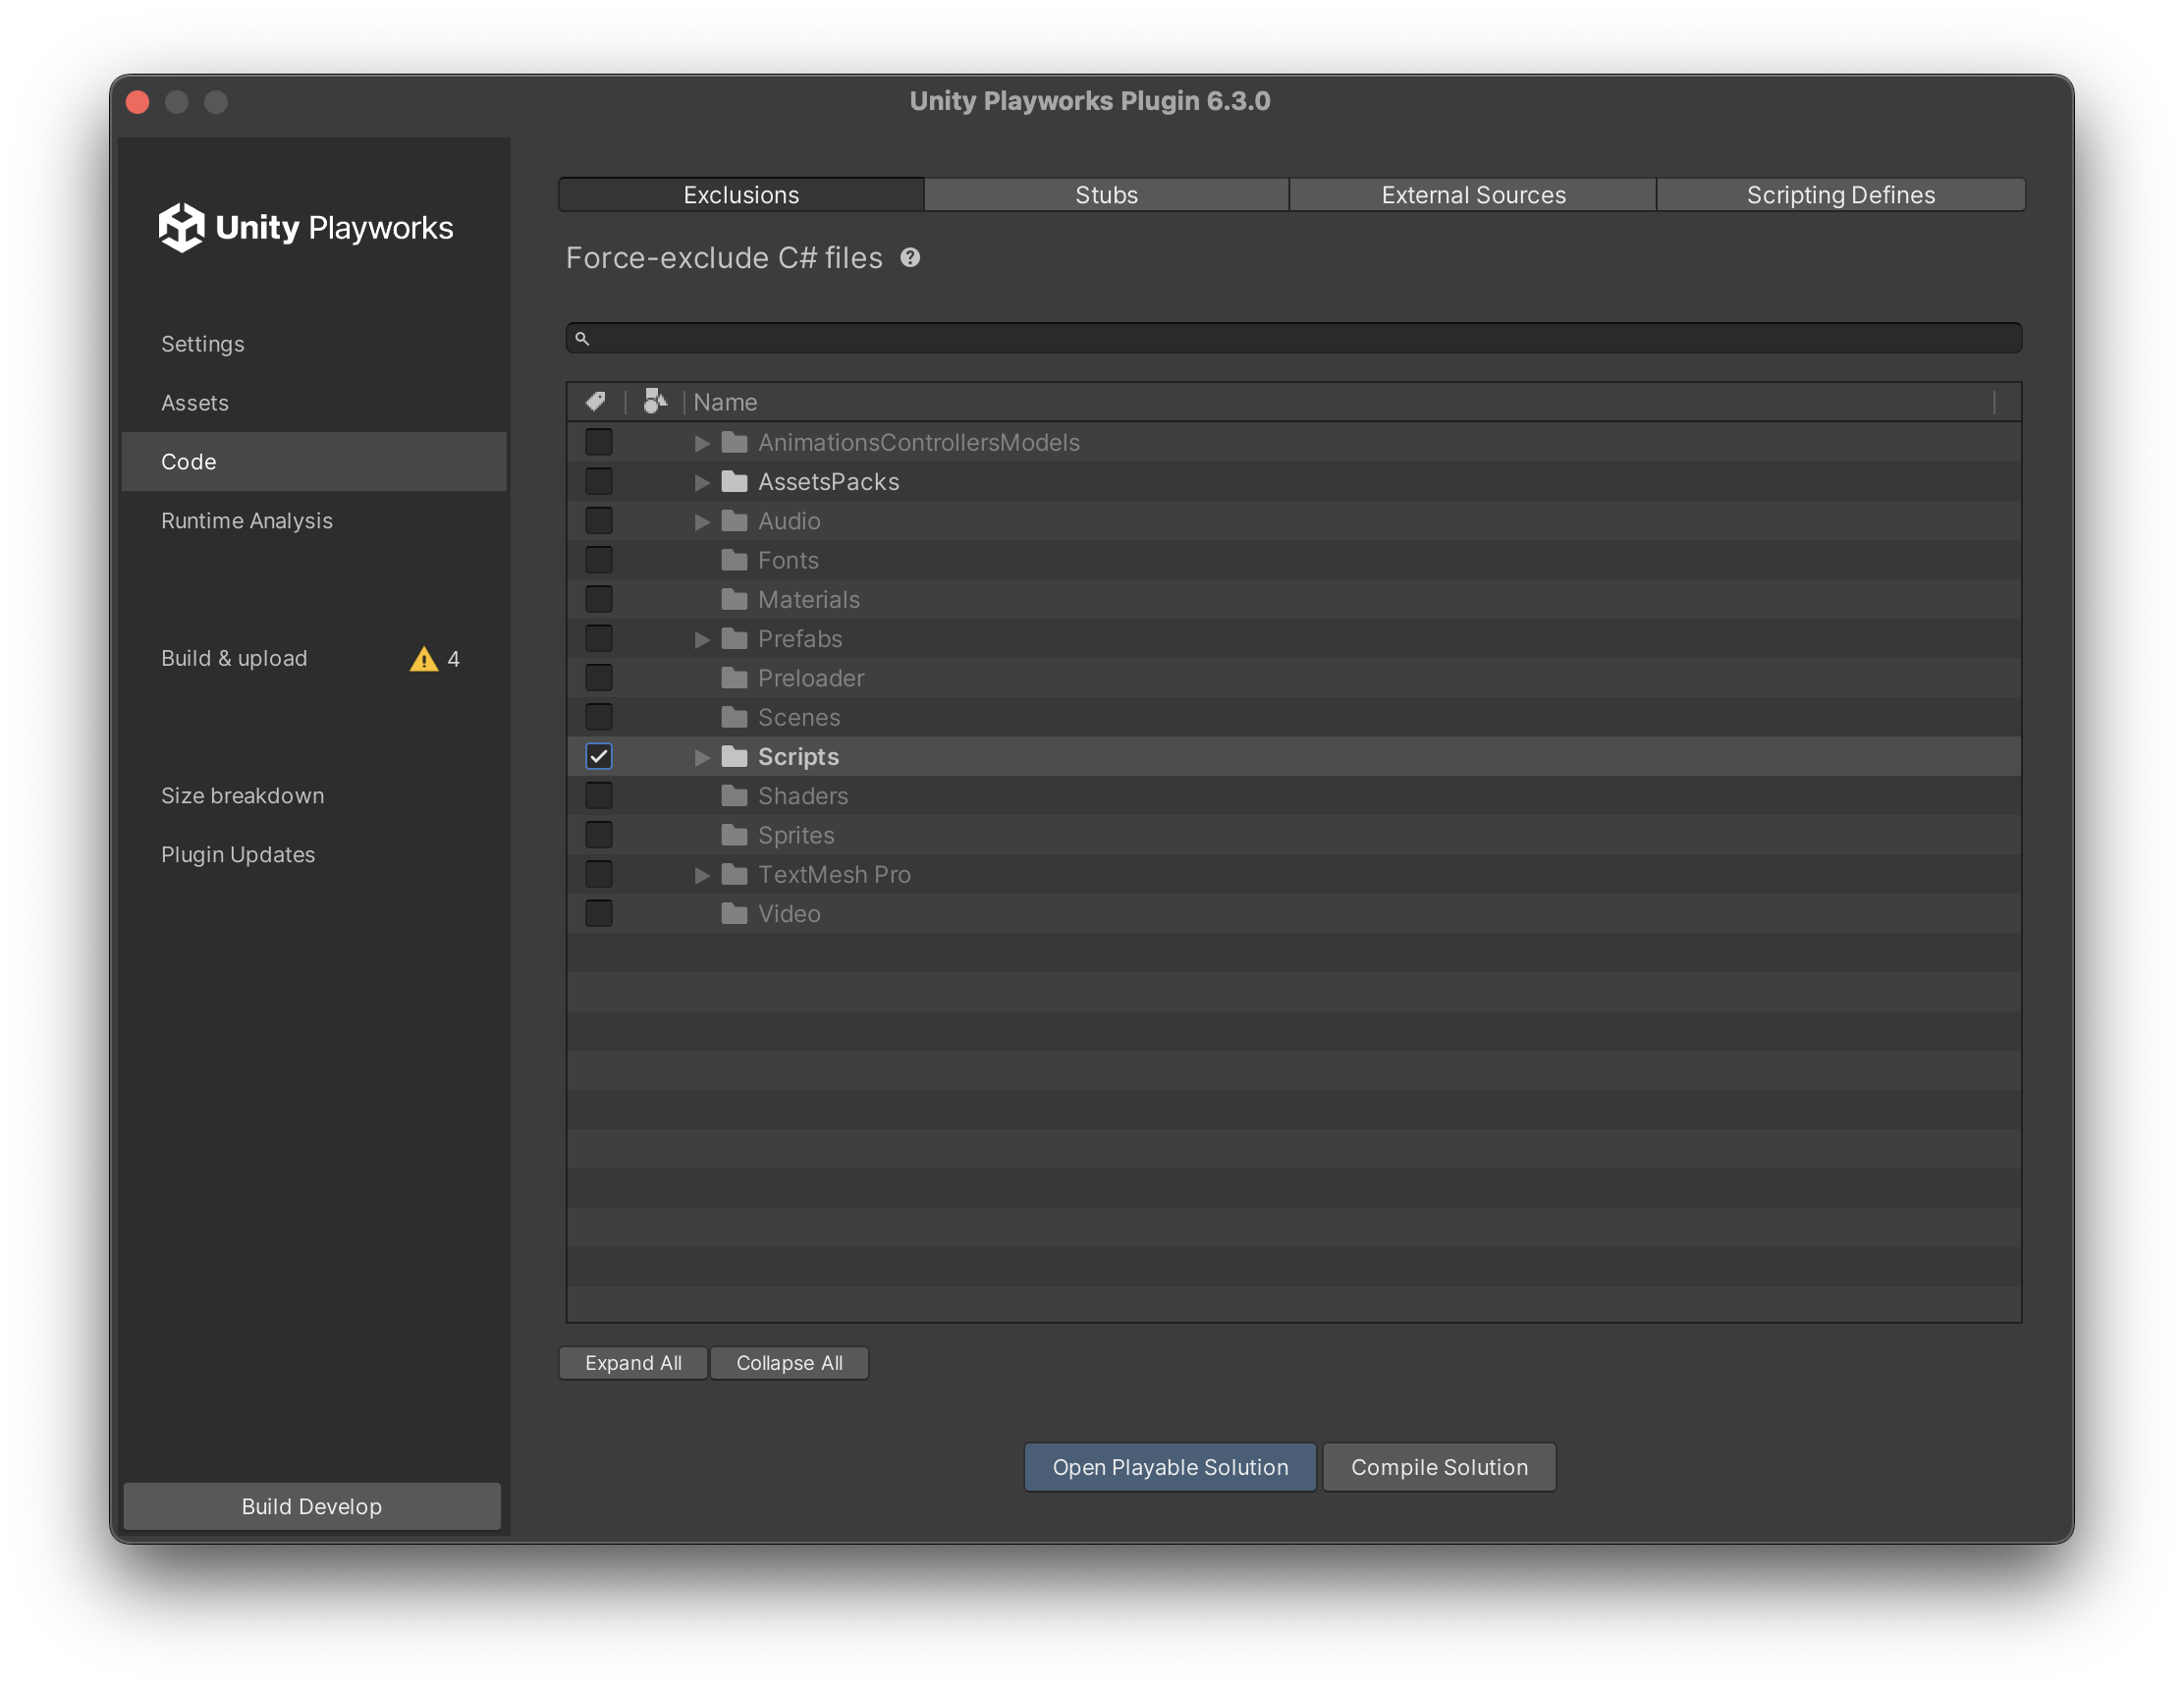
Exclude some scripts in Code section:
Build button changes to Build Develop (Code only):
If you untick excluded scripts back, Build button changes back to its previous state too, in our case to Open In Browser.
Revert detection doesn't work with Unity Assets or C# code, you'll have to rebuild Develop.
Your cache gets reset after updating to newer version of Playworks Plugin.
What changes doesnt affect cache?
Unity Playworks related changes doesn't affect local cache:
- Runtime Analysis (both for Code and Shaders)
- Settings in Build & upload/Upload to Unity Playworks tab
- Account settings in Settings/Account tab
- Platform specific settings in Settings/Ad Network (Global settings affect cache)
3. Last Build & Success Indicator
Project Diagnostics also displays at what date and time you last built (this includes builds that fail). This handy for keeping track of if you've applied your recent project changes to your Unity Playworks Plugin build.
(If you don't see a last build indicator it likely means you have yet to build)
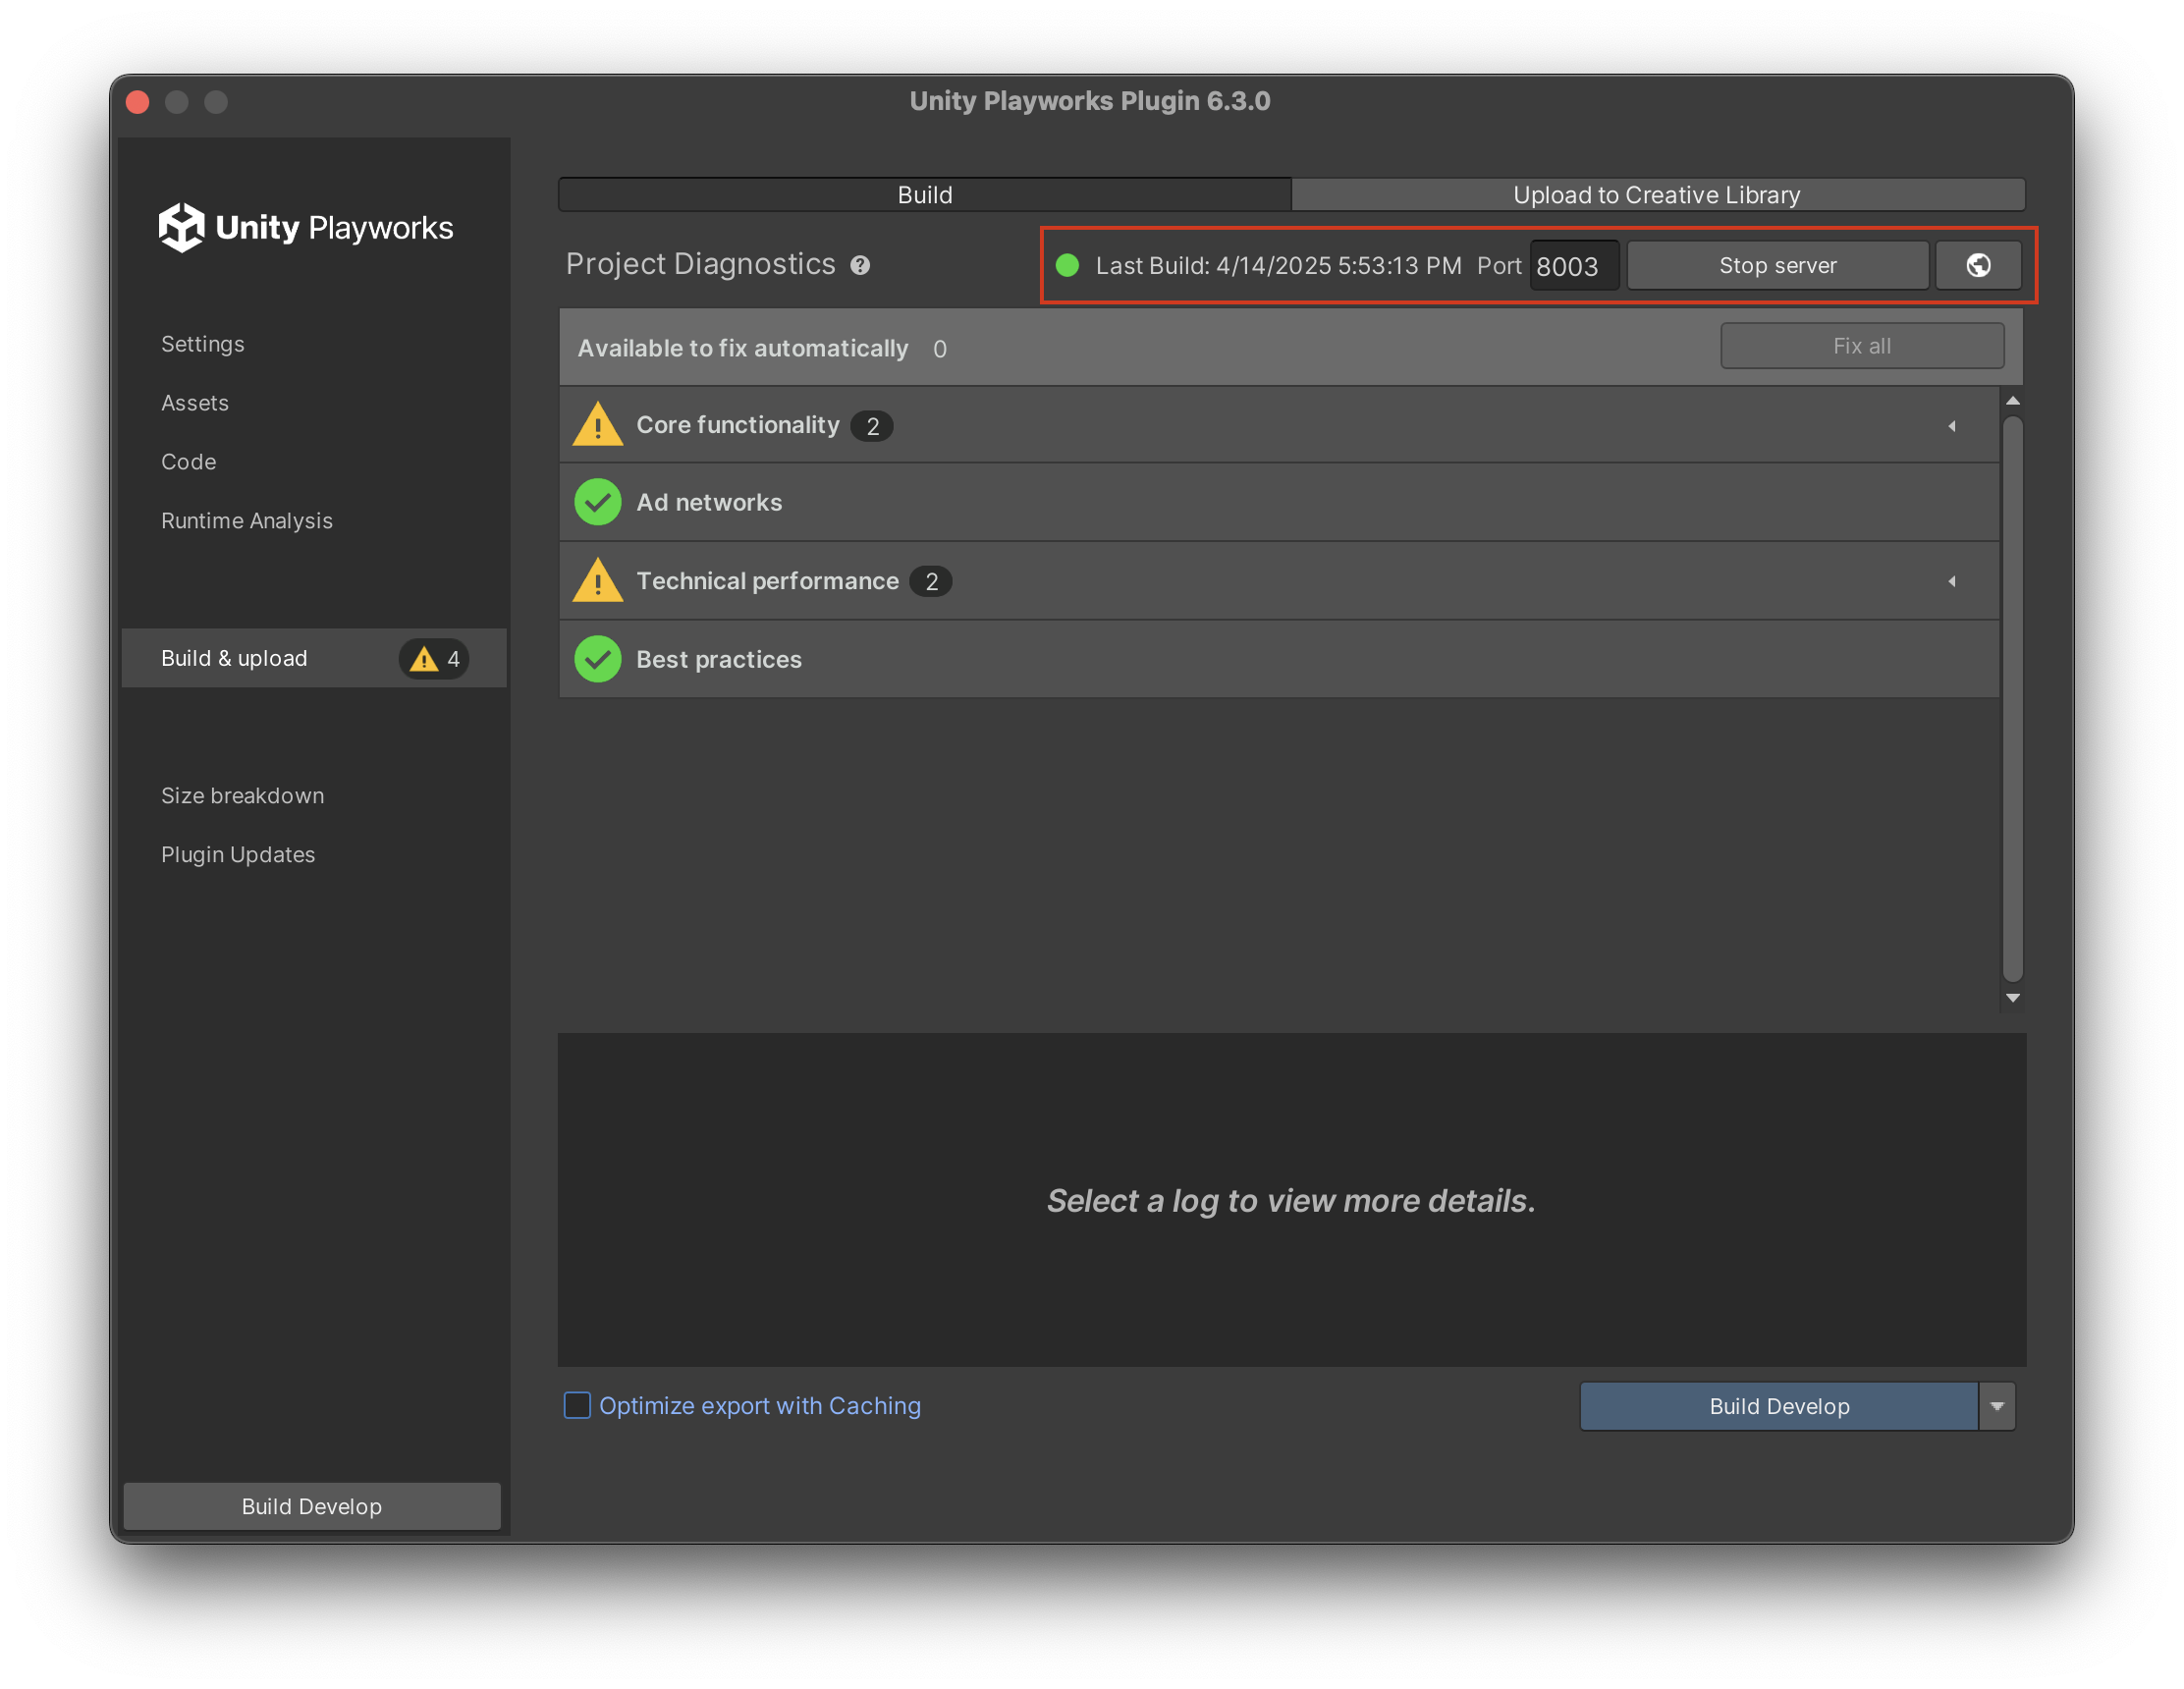
A build success indicator is also present to the left of the 'Last Build' information, in the form of a colored circle that will change color based on the outcome of the build:
- Green: build was successful
- Red: build failed
For more information on what happens at each step of the build process click here.
4. Double-click to Open
To open the file a diagnostic's error is pointing to, simply double-click on the error log. This will open the Unity script at the line where the error is stemming from. (Example of this process below)
5. Error Codes
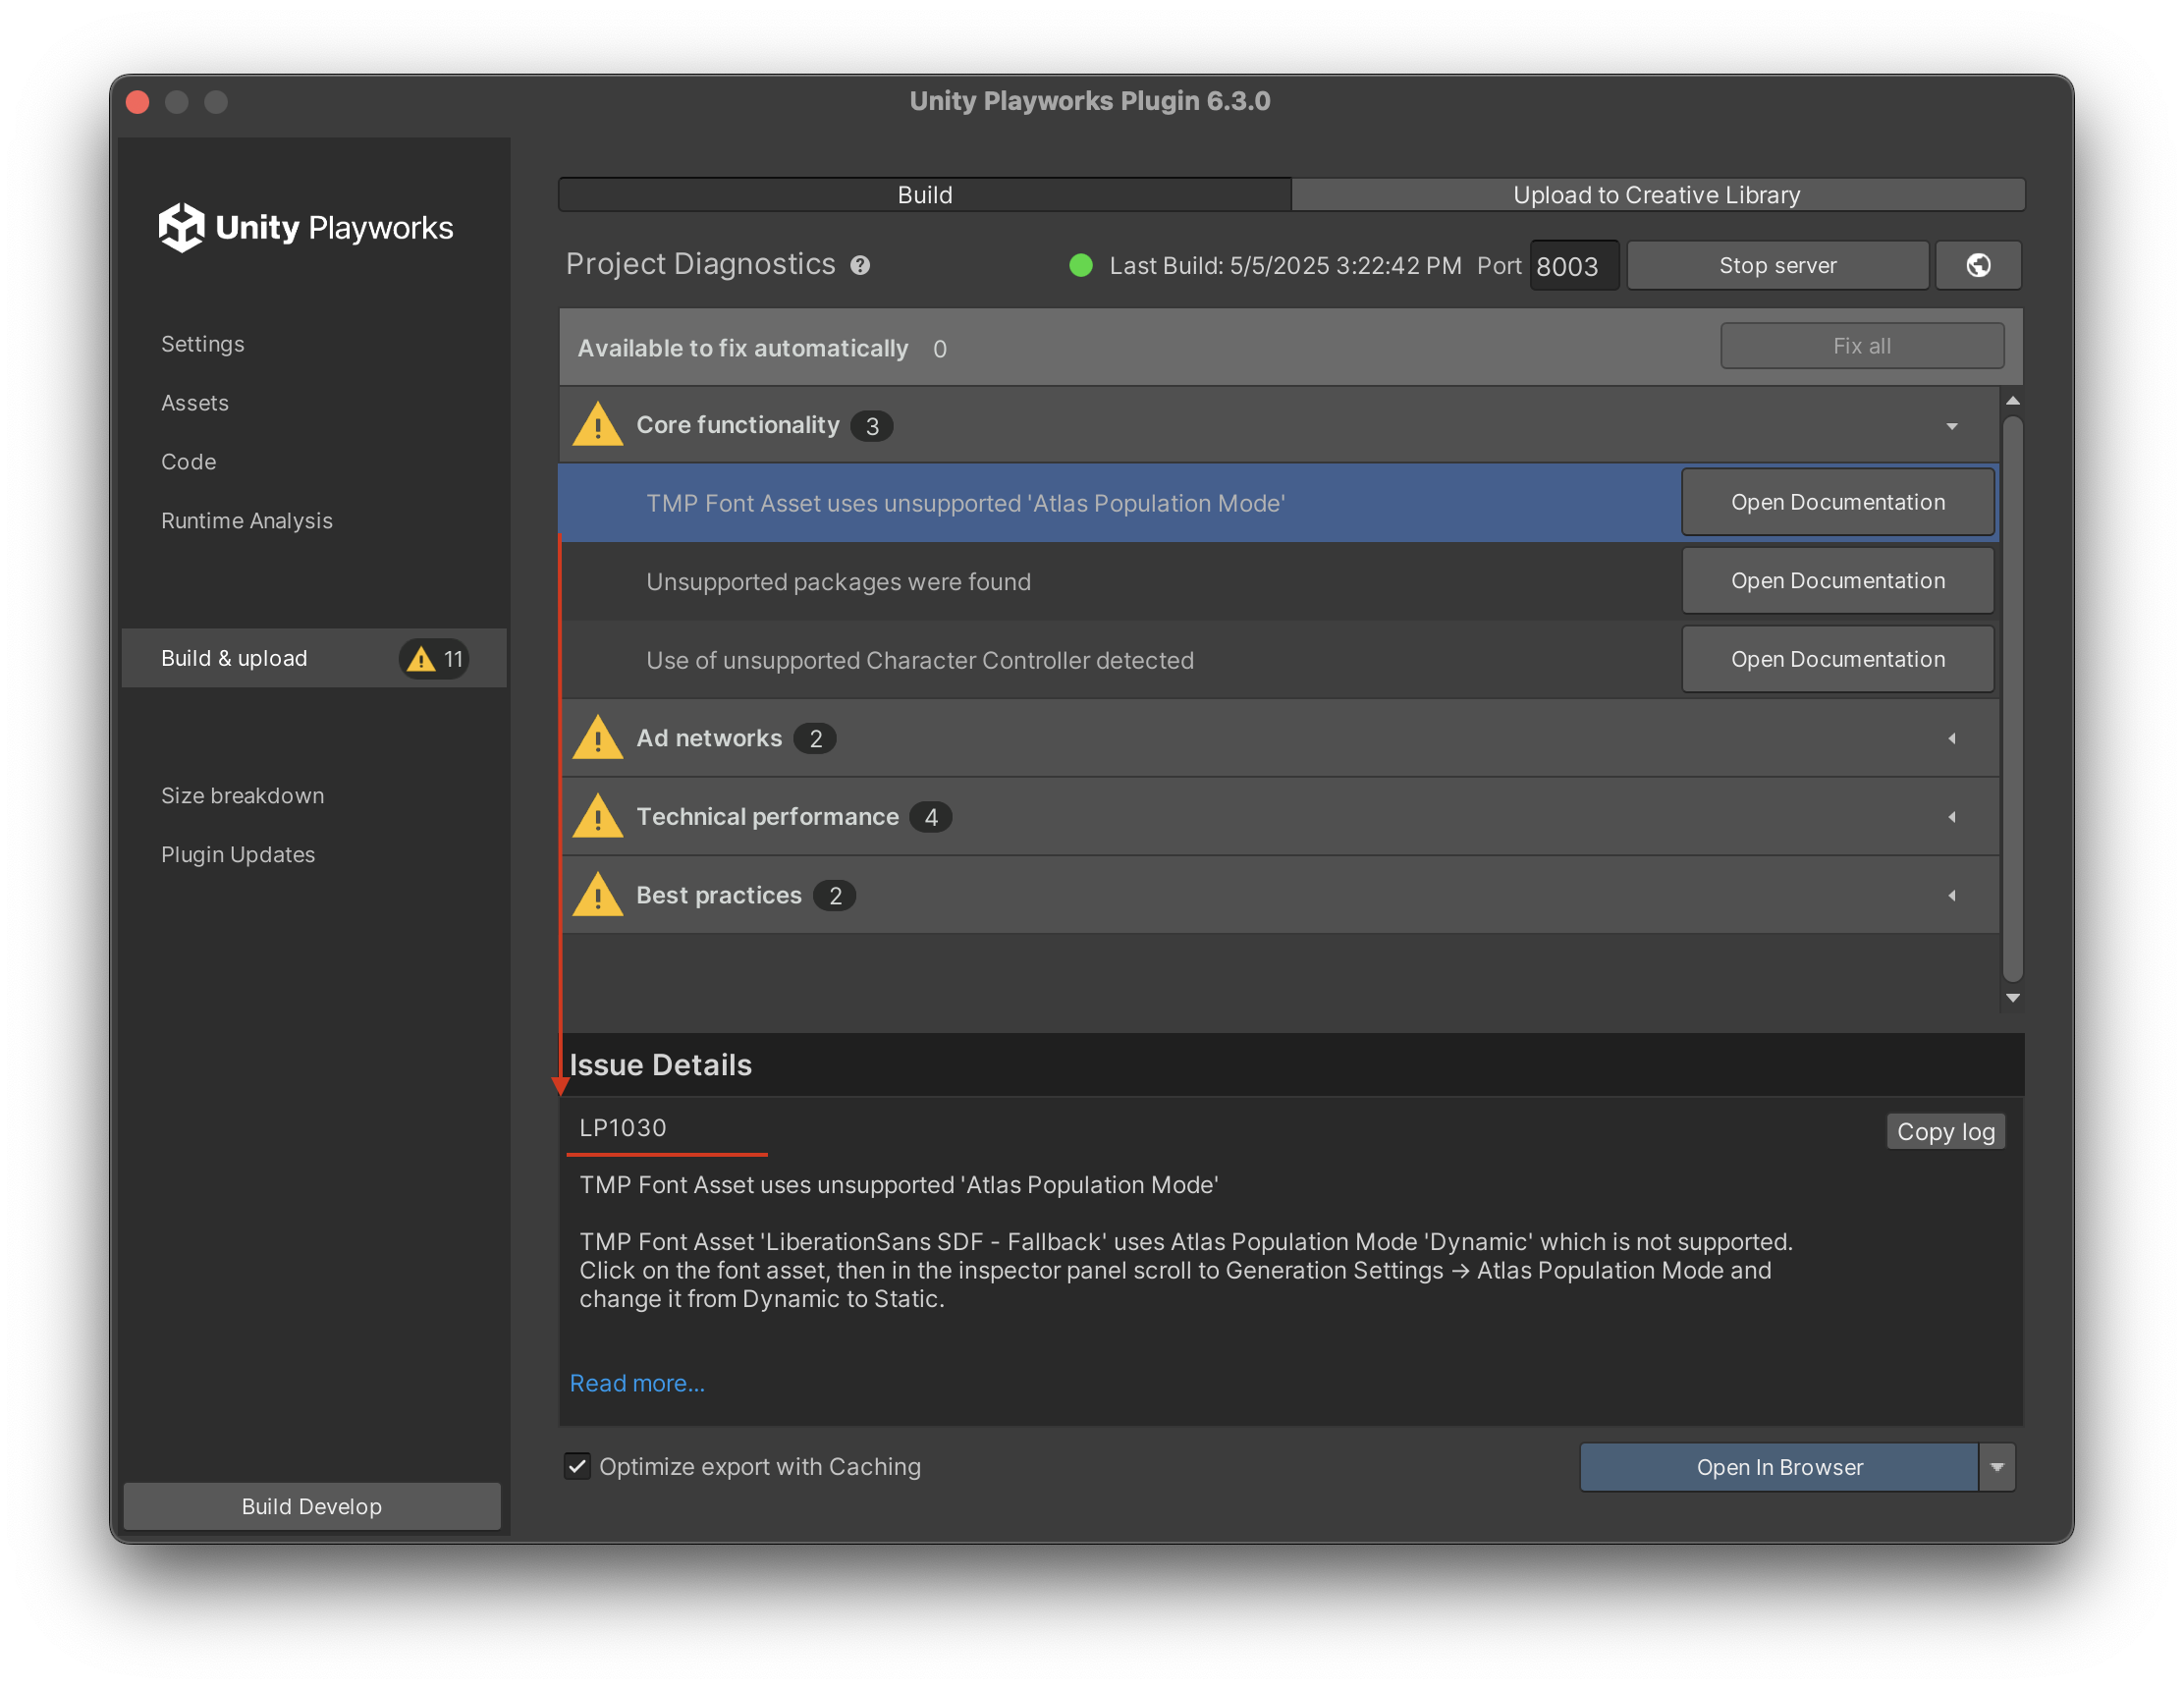
Diagnostic logs also come with unique error codes attached to them. These codes link to pages here in the documentation, that will provide an explanation of the error type as well as steps to fix.
You can easily find the corresponding docs page by selecting a log in the plugin (e.g. box 1 in the image below), and then clicking on the code in the log details section (e.g. in the image below: box 2, the underlined code).
Opening the Playworks Plugin Solution
Instead of opening your Unity solution file, you can instead use the "Open Playworks Plugin Solution" button in the code tab to open the solution file, regardless of whether there are any errors occurring. This is useful to be made aware unrecognised APIs as you code, saving changes in the Playworks Plugin Solution also saves them to your original Unity Scripts.
The scripts will use Plugin's version of the Unity Engine, while also linking changes made here to their original Unity counterparts.
How to analyse your project
Load the project you wish to build with Playworks Plugin in Unity.
Ensure you have Playworks Plugin installed and included in the project. To learn more about setting up Playworks Plugin visit our Getting Started guide.
Open the Playworks Plugin window and navigate to the Develop section, and hit 'Build'.
Issues with your project identified by the plugin will now appear in the window after the build finishes. The top table will contain issues grouped depending on the four predefined categories.
Selecting a log will display more specific information at the bottom of the panel, including the full error message and a code snippet of the issue.
You can double click on a log to open the relevant script at the line the message pertains to in the Playworks Plugin Solution. You can also click on the error-code at the beginning of diagnostic messages to be taken to the relevant documentation page here.
When to use it
Diagnostics is a useful way to view the compilation status without having to compile your project or switch over to your IDE.
Often you may want to simply exclude any code that won't be needed in your playable, simply open the Diagnostics (and hit 'Refresh') to see how these changes impact the compilation. The same is true for the other code related Plugin features;
With the 'Compile' button you can trigger a code compilation, this will recompile your code without executing a full build (exporting assets). This is useful when iterating on code changes since it will be faster than a 'Develop' build but means only code changes will be updated in the output.
Opening the Playworks Plugin Solution
To open the file a diagnostics error is pointing to, simply double-click on the error message shown in the window. This will open the script at the line where the error is stemming from:
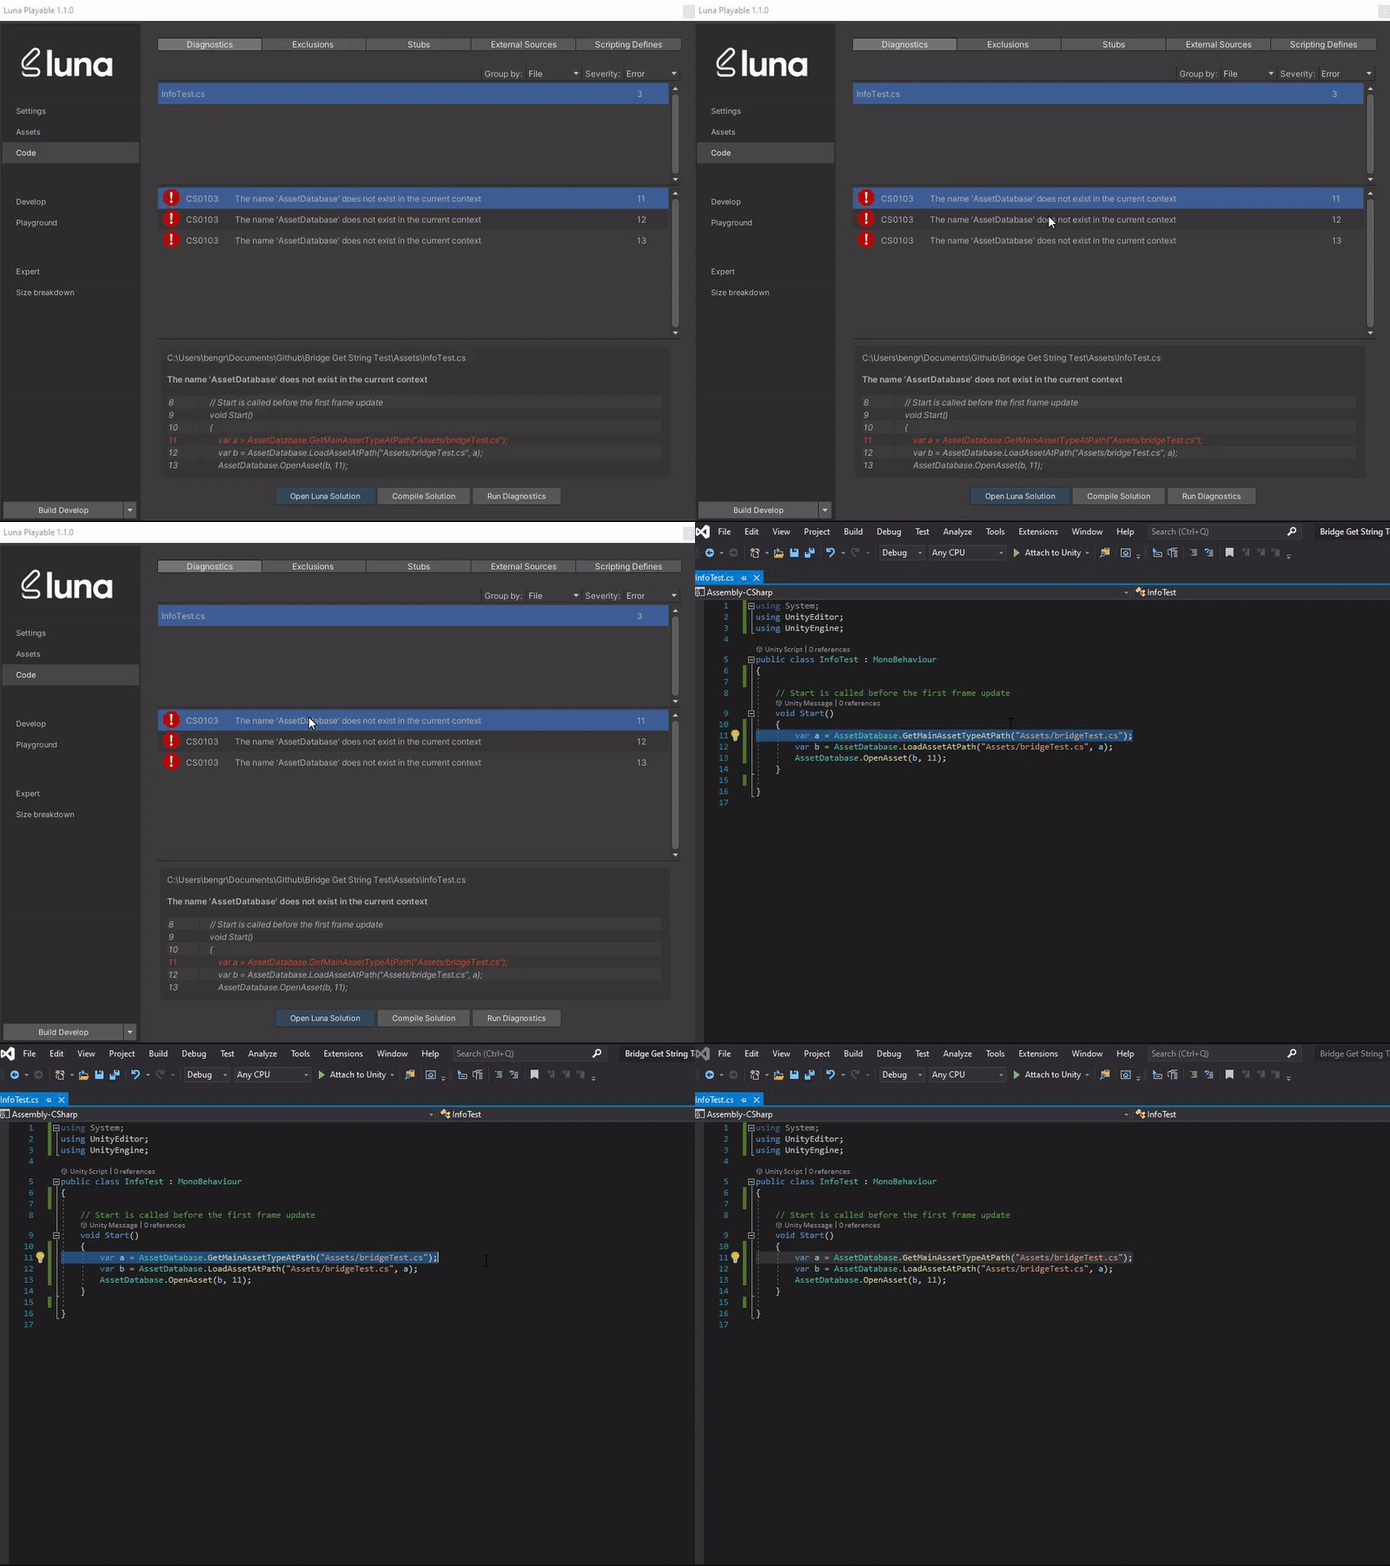
The scripts will use Plugin's version of the Unity Engine, while also linking changes made here to their original Unity counterparts.
Alternatively you can use the "Open Playable Solution" button at the bottom of the same window to open the solution file, regardless of whether there are any errors occurring.
How it works
To analyse the solution, Diagnostics will construct the solution file in the same way as the build process but rather than compiling it to JavaScript, we instead analyse the project with Roslyn to quickly obtain all compilation information.
Diagnostic logs are grouped either by the CS error code, or by the file in which they occur, you can change this with the 'Group By' option.
Any errors you see in this panel regarding the UnityEngine namespace, actually refer to our version
of UnityEngine and therefore highlight compatibility issues between your project and Unity Playworks Plugin.
How to analyse your project
Load the project you wish to build with Playworks Plugin in Unity.
Ensure you have Playworks Plugin installed and included in the project. To learn more about setting up Playworks Plugin visit our Getting Started guide.
Open the Playworks Plugin window and navigate to the Code section, and the Diagnostics tab.
Issues with your project identified by the plugin will now appear in the window. The top table will contain issues grouped depending on the 'Group By' option, selecting an entry here will populate the table below with the logs for that particular group.
Selecting a log will display more specific information at the bottom of the panel, including the full error message and a code snippet of the issue.