Measuring Startup Time
Your playable ads can be measured for startup time, allowing you to determine where improvements can be made.
It is not very accurate to test startup time on PC/Mac as they have much more power. As a quick check, you can see what affects the performance the most. However, results on actual devices might be different, so it's a good idea to test them.
The startup test on Develop build is not very accurate, as different platforms have different requirements and compression algorithms. Therefore, check your performance on a build for your target platform.
How to measure your startup time
The startup time of your creative can be measured for development builds and ad networks builds.
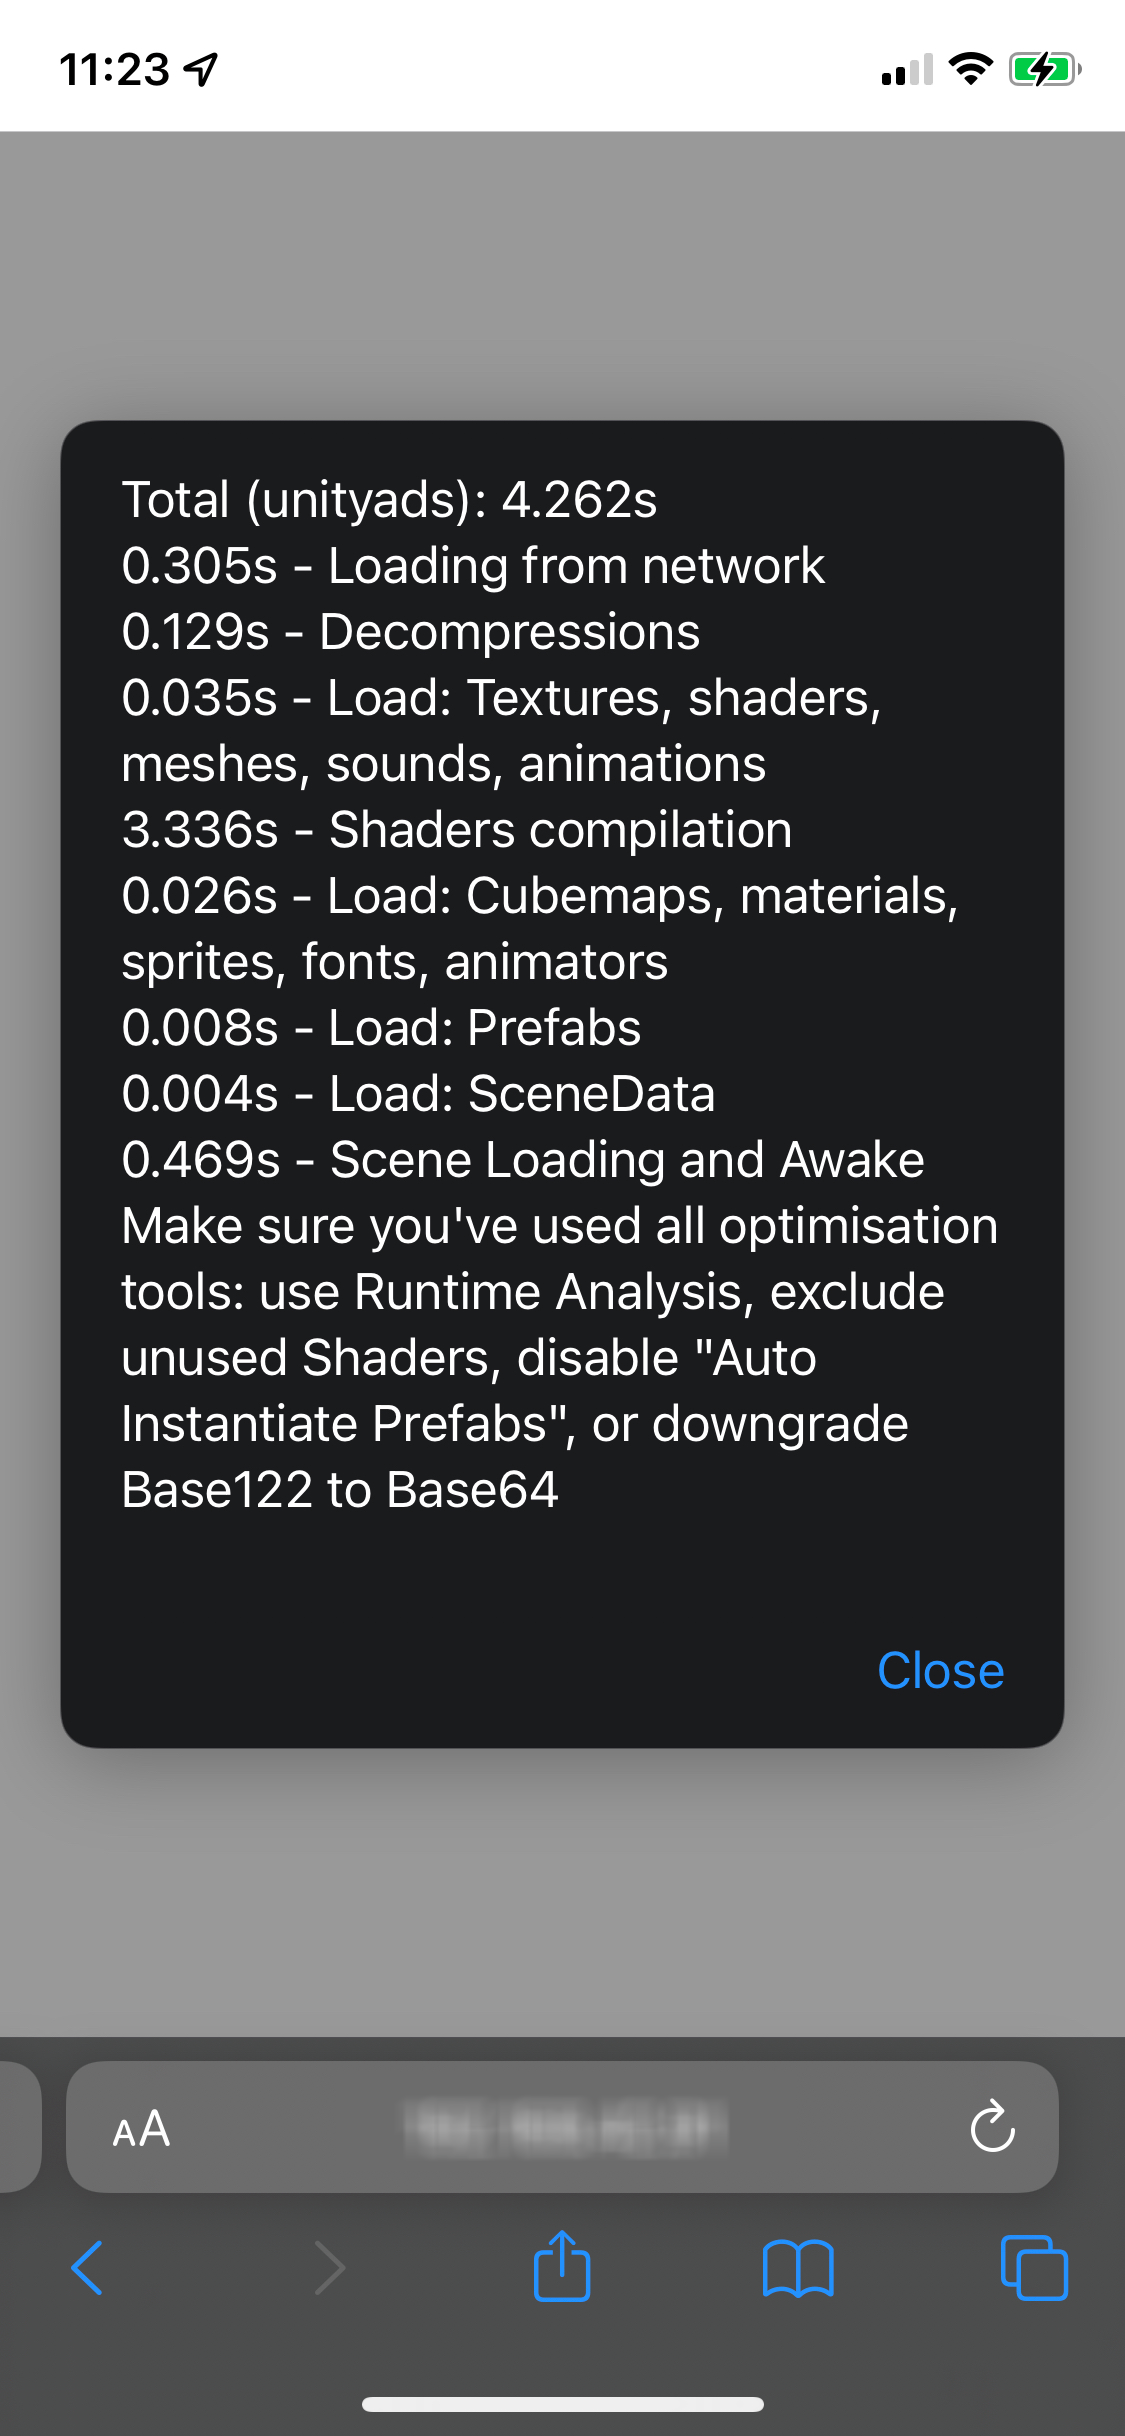
The startup measurement result will look like this:

This consist of different fields which provide you with different details about the startup time.
For testing purposes, check out how to test your creative on a mobile device.
How to interpret the results
The following table discusses how the different fields in the measurement result work, along with how they can be improved.
For more information on optimisations for startup time, visit this page.
| Field | Description | How to improve |
|---|---|---|
| Average Total | This field will gather and recalculate the average time collected from several ad launches. This will reset every time a user re-builds a project. | |
| Loading from network | Here you will find how long it took to download your playable from the network (can vary depending on network conditions). | Try to improve the overall size of your playable. Smaller size → faster downloading. |
| Decompressions | This Field displays the time it took to decompress your game: zipping, unbrotli, base64 and 122 decompressions. | Compressions allows to make your playable small and match ad network requirements. For now, users can switch from base64 (bigger size but faster decompression) to base122 (smaller size but longer decompressions). Performance may vary depending on the browser version. |
| Load Textures, shaders, meshes, sounds, animations | This Field shows the time needed to load simple assets in memory. Performance may vary depending on the browser version (for textures, sounds, shaders - as browser can load them natively). | Remove all unused assets. Meshes half precision optimisation also increases loading time. Opmitise AnimationClips to use as few keyframes as possible. |
| Shaders compilation | It is important to keep this Field well optimised or it might eat up a lot of time. Be careful to use as few shader variants in the build as possible. | First step is trying to use as few materials/shaders as possible. Use Shaders Runtime Analysis - part of Runtime Analysis which can collect only used variants in scene and strip all the other variants - in the Assets → Shader section in the Plugin UI, to exclude all not needed shaders and variants. |
| Load: Cubemaps, Materials, Sprites, Fonts, animators | This Field deals with the loading of more complex assets. | Remove all unused assets. For optimising sprites, it can be useful to use FullRect mesh mode instead of Tight. For optimising fonts, keep the font texture size down by only using symbols with the appropriate resolution per glyph by using the Plugin UI. |
| Load: Prefabs | This Field shows the duration of time it took to load a project prefab. | Try to use as few GameObjects as possible - as huge hierarchies take more time to load. |
| Load: Scene Data | This Field shows the scene asset loading time. | Try to use as few GameObjects as possible - as huge hierarchies take more time to load. |
| Scene loading and Awake | This Field shows the time needed to load the scene into memory, awake all components, and render the first frame of the game. | Make sure your scripts in awake are as performant as possible, and try to use as few GameObjects as possible. |
As measuring performance is a tricky task, it may change dramatically depending on the workload of the current machine. If you have a lot of devices/applications opened in the background, it will affect the performance.