Events Timeline
The Events Timeline page provides an overview of analytics events associated with your playables. It allows you to get a visual representation of how users interact with your playable and helps you identify strong and weak interaction areas.

Chart
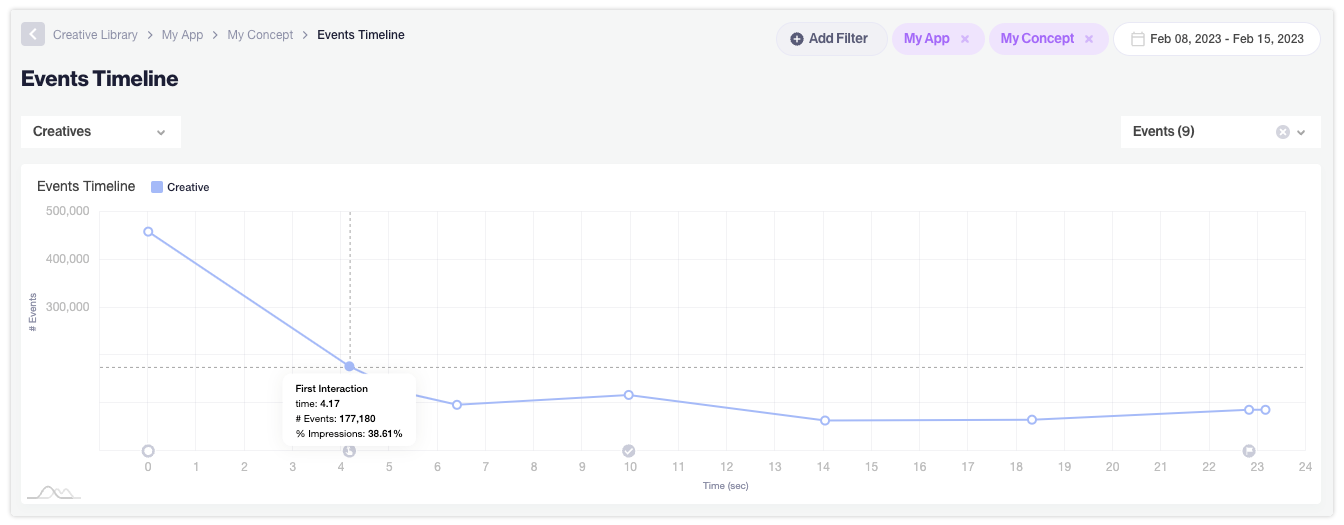
On the chart, you will see a time series plot of events in your playable:
- The X-axis represents the median time of starting from impression
- The Y-axis signifies the frequency of the event's occurrence.
Hovering over each dot on the chart will give detailed information about the specific event.
Table

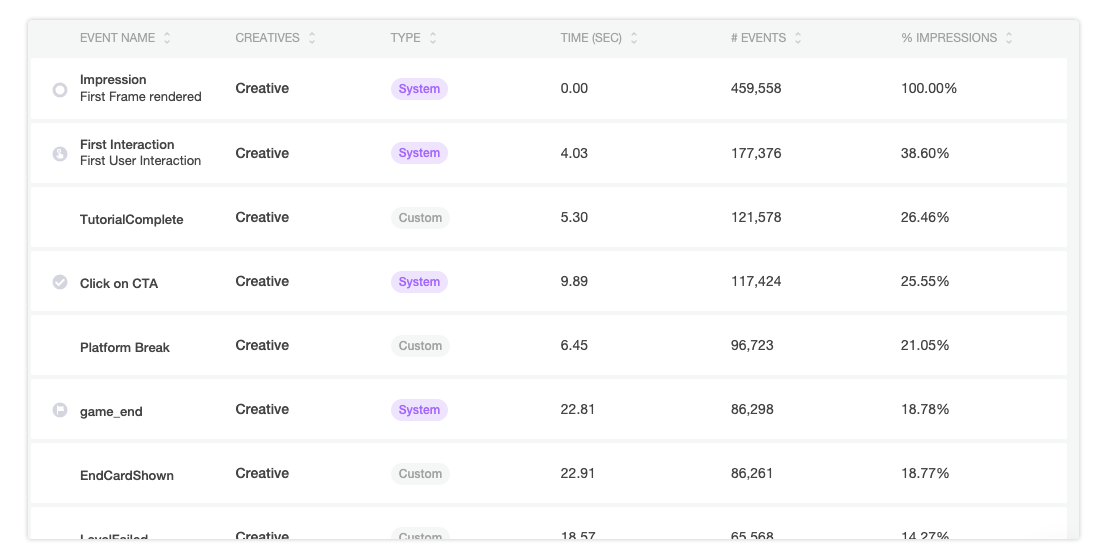
| Heading | Definition |
|---|---|
| Event Name | Name of the custom event as defined by you in your project. |
| Type | The event’s type: standard or custom. Learn more about standard and custom events. |
| Time | The median time from impression for an event to be triggered (in seconds). |
| # Events | Count of the event’s occurrence |
| % Impressions | The event’s occurrence as % of total impressions, calculated as count of events divided by count of impression |
Date Range
To modify the date range, select the new range from the date picker on top right of the page. You’ll need to click Apply for the page to update with data from the new time frame
Filtering Data
You can filter data on both the chart and table by using filters on top right of the page. This includes the ability to filter by specific events, or by dimensions like Ad Network, Country, OS. Once you’ve selected the required filter options, the data will automatically update on the page
Comparing Data
You can enable comparison by using the dropdown on top left of the page. When you select an option to compare the events data, the chart and table will automatically refresh to show data grouped by the selected dimension.
For example, if you have three concepts A,B and C in your app and you want to compare events data for these concepts, select ‘Concepts’ in the dropdown. The chart and table will now update to show you data of each concept. On the table you can refer to separate event count, median time and % impression for individual concepts.
If you’d like to compare events of only two concepts, you can further use filters on top right to exclude concept C from the page