User Journey
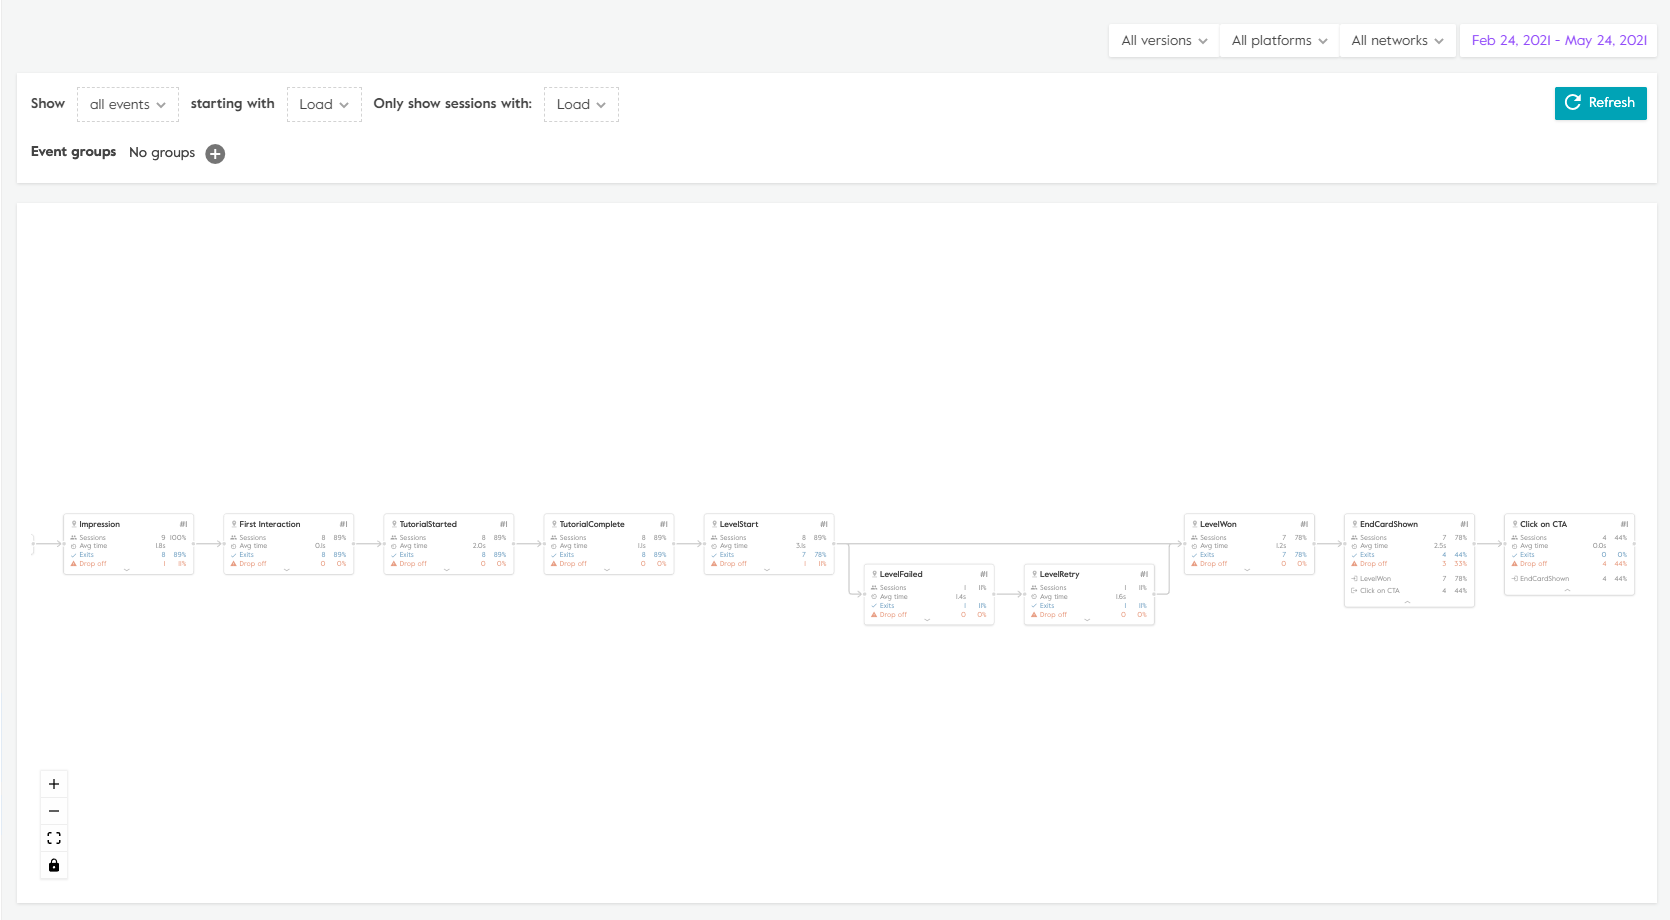
The User Journey report presents you with a fully interactive visualisation of how users interact with a progress though your playable, as a series of connected events.
Each event is represented by one of more tiles, which contains information related to the event, time spent and also entry and exit points.

And looking more closely at a section of the resulting journey:

Clicking on the 'x' in the top right of the nodes removes them from the journey, you will need to click 'Generate' again to apply these changes.
Generate a report
The User Journey page allows you to generate custom reports using the report builder. The top level filters will be applied to any report that you generate.
Events - be default, all events are selected. This menu item allows you to remove certain events or add a specific set of events to create a specific view of your users' journey.
Starting with - where the user journey starts i.e. the first event. All session data presented in the funnel will be based on the starting event define in the report. As an example, by using "Impression" as the starting event, all data is therefor shown as a % of total impressions.
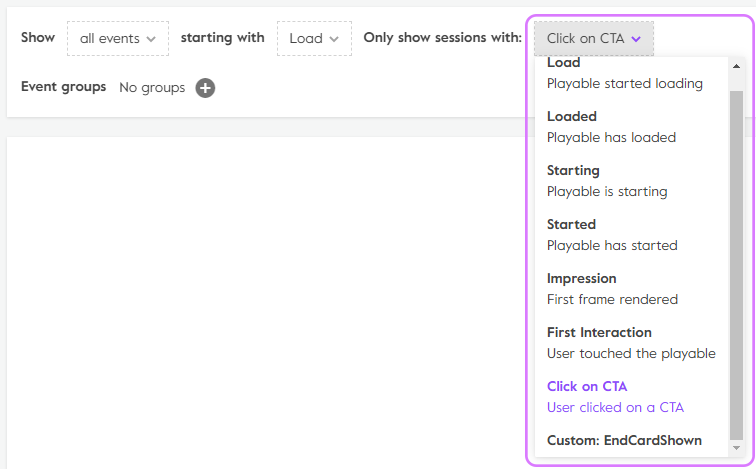
Only show sessions with - filters the user journey so that only session that contain a specific event are displayed. For example you can filter to only see sessions that had install events to help identify any particular patterns in behaviour.

- Events group - events groups allow you to group two or more events into a custom group in the user journey report. This feature allows you two quickly group similar events and can allow you to interpret the report more easily i.e. grouping two similar events causing an unnecessary fork in the flow.
Event Tile Definitions
- Event Name - the name of the standard or custom event.
- Sessions - the total number and percentage of user sessions which include this event. In this case, sessions are filtered based on the starting event define in the report. As an example, by using "Impression" as the starting event, all data is therefore shown as a % of total impressions.
- Avg time - the average time (mean) spent in a given state i.e. time before the next event.
- Exits - the total number and percentage of sessions which continue after this event i.e. triggers one or more subsequent events.
- Drop off - the total number and percentage of sessions which exit after this event i.e. do not trigger any subsequent events.
Advanced
- Inbound events - the total number and percentage of the events which came directly prior this event.
- Outbound events - the total number and percentage of the events which cam directly after this event.